Income Statement Table by Year
RM0600004_25
- Last Update 02/24/2025
- File Size 0.2MB
- # of Slides 2
- File Format PPTX
- Slide Ratio 16:9
- Color
Keywords
- #Content-Based Slides
- #Design-Based Slides
- #Financial Plans and Performance
- #Diagram
- #Income Statement
- #Cash Flow Statement
- #Table
- #16:9
- #income statement PowerPoint slide
- #financial table presentation
- #year-over-year income statement design
- #financial data table slide
- #how to make an income statement in PowerPoint
About the Product
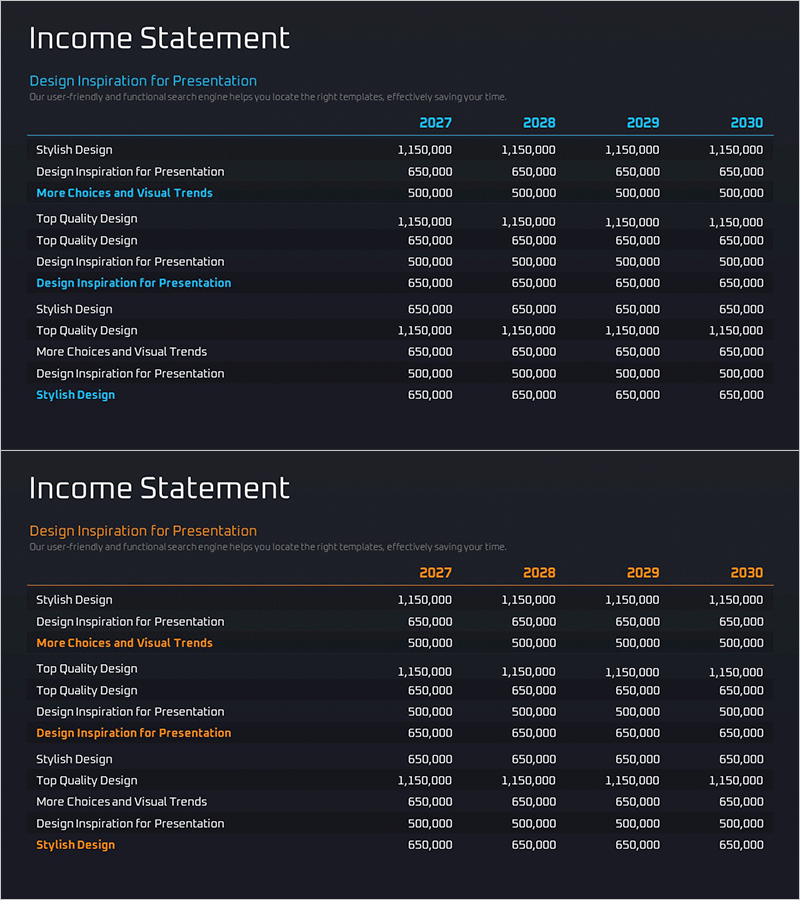
A financial data presentation slide featuring an income statement table in PowerPoint format. The 2-slide deck uses a dark background with cyan header styling to display year-over-year financial figures across four years (2027–2030). Each row clearly separates line items from corresponding annual amounts, making it ideal for investor presentations, financial reports, and business plan financial sections. The table layout provides distinct input areas for easy data editing while reinforcing corporate financial credibility and analytical rigor in your presentation.
Usage Points
-
Main Usage
Visually present annual income statement data to establish financial credibility and transparency. Optimized for investor relations (IR) presentations, financial reports, and business plan financial sections where precise revenue, expense, and profit figures must be clearly communicated.
-
How to Use
Input actual income statement line items (revenue, operating expenses, net income, etc.) and corresponding year-over-year amounts into the dark-background table. Modify the year headers (2027–2030) to match your reporting period, then update each row's figures to reflect current financial performance.
-
Recommended For
CFOs, finance managers, investor relations specialists, and executives presenting to stakeholders (investors, financial institutions, board members, employees). Particularly effective for annual financial performance reviews, mid-term financial planning presentations, and investor roadshow materials.
-
Slide Structure
2-slide set with title area (Income Statement), descriptive subtitle, and a structured table featuring 4 year columns and 10–12 financial line items. Cyan header row and dark background maximize numerical readability and visual hierarchy.
Related Products
-

Vibrant Paint Splash Table Slide – Financial Performance at a Glance
#Financial Plans and Performance #Diagram #Income Statement
-

Income Statement Table – Visualizing Financial Performance
#Financial Plans and Performance #Diagram #Income Statement
-

Activity Time & Calorie Burn Table – Structure for Financial Performance
#Financial Plans and Performance #Diagram #Income Statement
-

Green Blue Standard Table – Visualizing Financial Plans
#Financial Plans and Performance #Diagram #Income Statement
