Balloon Pile Table Chart – Communicating Financial Performance
RJ0500023_19
- Last Update 06/13/2025
- File Size 1.2MB
- # of Slides 2
- File Format PPTX
- Slide Ratio 16:9
- Color
Keywords
About the Product
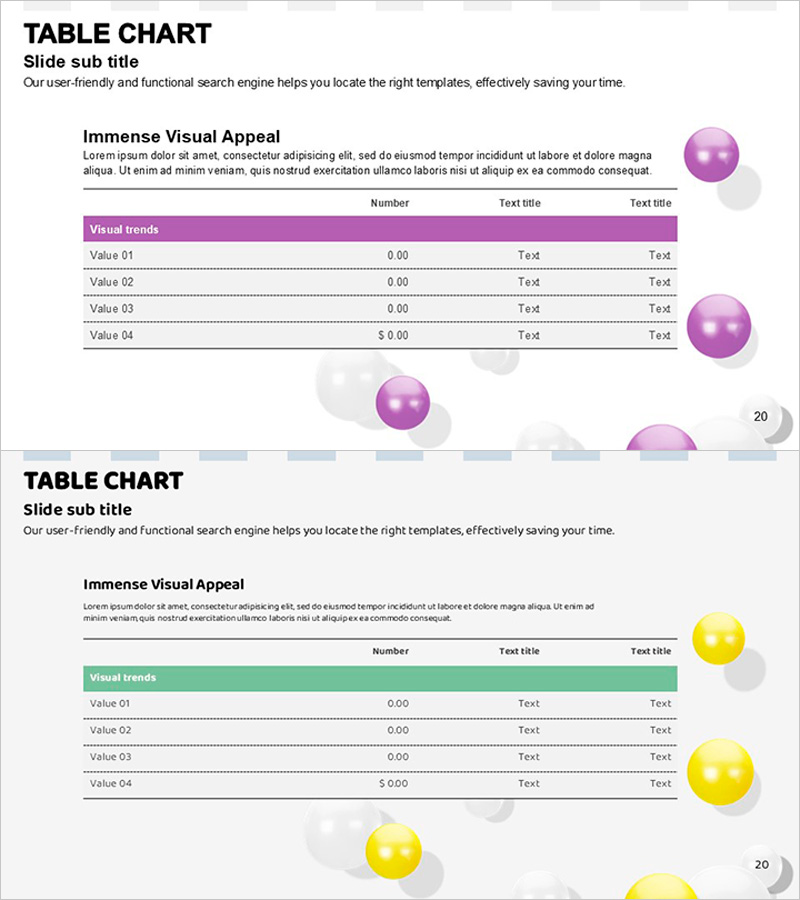
A PowerPoint slide set that visualizes financial performance and numerical data using 3D balloon pile graphics. The 2-slide composition features purple and yellow-toned balloon elements that emphasize table data, making complex figures like income statements, cash flow statements, and financial metrics intuitive and impactful. Color-coded header rows (purple and green) clearly distinguish categories, with ample text input areas for immediate data entry. Ideal for investor presentations, executive reports, and financial analysis decks.
Usage Points
-
Main Usage
Visualizes financial performance, income statements, and cash flow data using 3D balloon graphics to create visual impact and improve readability for stakeholders, investors, and executives. Transforms complex numerical information into intuitive visual communication.
-
How to Use
Use in investor relations materials, financial reports, executive briefings, and quarterly earnings presentations. Enter numerical values in the table's Number column, and the balloon size automatically represents data proportions for visual emphasis.
-
Recommended For
Recommended for CFOs, finance teams, IR departments, executives, and investor presentations. Suitable for quarterly earnings reports, fundraising pitches, financial analysis meetings, and shareholder meetings requiring data-driven decision support.
-
Slide Structure
2-slide composition with title, subtitle, and descriptive text areas on each slide, plus a 4-row table (Number and Text title columns). Header rows are color-coded in purple and green, with 3D balloon elements positioned on the right to emphasize numerical values.
Related Products
-

Profit and Loss Analysis Table Chart – Visualizing Financial Performance
#Financial Plans and Performance #Diagram #Income Statement
-

Year-over-Year Comparison Income Statement – Financial Performance Analysis
#Financial Plans and Performance #Diagram #Income Statement
-

Activity Time & Calorie Burn Table – Structure for Financial Performance
#Financial Plans and Performance #Diagram #Income Statement
-

Green Blue Standard Table – Visualizing Financial Plans
#Financial Plans and Performance #Diagram #Income Statement
