Visualizing Financial Performance with IR Income Statement – Professional and Stylish Design
RM0600002_25
- Last Update 02/23/2025
- File Size 1.2MB
- # of Slides 2
- File Format PPTX
- Slide Ratio 16:9
- Color
Keywords
- #Content-Based Slides
- #Design-Based Slides
- #Financial Plans and Performance
- #Diagram
- #Income Statement
- #Cash Flow Statement
- #Table
- #16:9
- #income statement PPT slide
- #financial data table PowerPoint
- #how to make an income statement in PowerPoint
- #investor presentation financial slide
- #income statement template download
About the Product
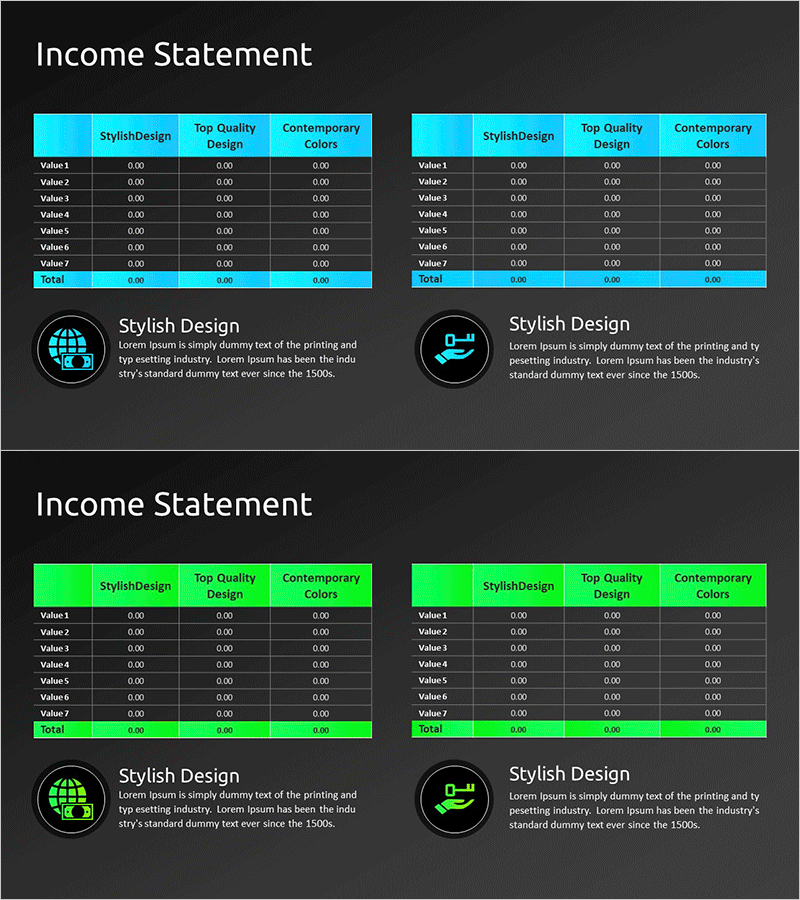
A 2-slide PowerPoint set optimized for investor presentations and financial reporting. Dark background with cyan and lime header rows creates high-contrast table layouts for clear financial data visualization. Each slide features a 3-column structure (Stylish Design, Top Quality Design, Contemporary Colors) with 7 data entry rows, plus icon and descriptive text areas to reinforce financial credibility. Ready-to-use for quarterly earnings presentations, investor meetings, financial planning reports, and IR materials.
Usage Points
-
Main Usage
Communicate quarterly and annual financial performance clearly to investors, executives, and stakeholders through visual income statement slides. Supports data-driven decision-making and strengthens financial credibility.
-
How to Use
Enter actual financial figures into the 7 data rows (Value 1–7, Total) on each slide, and customize the 3 column headers to match your company's reporting structure. Add company logos or department icons in the icon area to enhance branding.
-
Recommended For
CFOs, finance teams, and IR professionals preparing quarterly earnings presentations, investor meetings, and financial planning reports. Suitable for startup fundraising pitches, public company earnings announcements, internal financial reviews, and board presentations.
-
Slide Structure
2-slide set with each slide containing a title area, 3-column header row (Stylish Design, Top Quality Design, Contemporary Colors), 7 data entry rows (Value 1–7, Total), left-side icon area, and right-side descriptive text section for financial insights.
Related Products
-

Green Blue Standard Table – Visualizing Financial Plans
#Financial Plans and Performance #Diagram #Income Statement
-

Balloon Pile Table Chart – Communicating Financial Performance
#Financial Plans and Performance #Diagram #Income Statement
-

Activity Time & Calorie Burn Table – Structure for Financial Performance
#Financial Plans and Performance #Diagram #Income Statement
-

Income Statement Table by Year
#Financial Plans and Performance #Diagram #Income Statement
