Bar Chart & Income Statement Table – Market Analysis and Financial Performance
RJ0300039_11
- Last Update 04/28/2025
- File Size 1.7MB
- # of Slides 2
- File Format PPTX
- Slide Ratio 16:9
- Color
Keywords
- #Content-Based Slides
- #Design-Based Slides
- #Market and Competitor Analysis
- #Financial Plans and Performance
- #Diagram
- #Graph
- #Future Outlook
- #Income Statement
- #Table
- #Horizontal Bar
- #Standard Table
- #Horizontal Bar Chart
- #16:9
- #horizontal bar chart PowerPoint
- #income statement slide template
- #financial performance presentation
- #market analysis chart
- #bar graph PowerPoint slide
About the Product
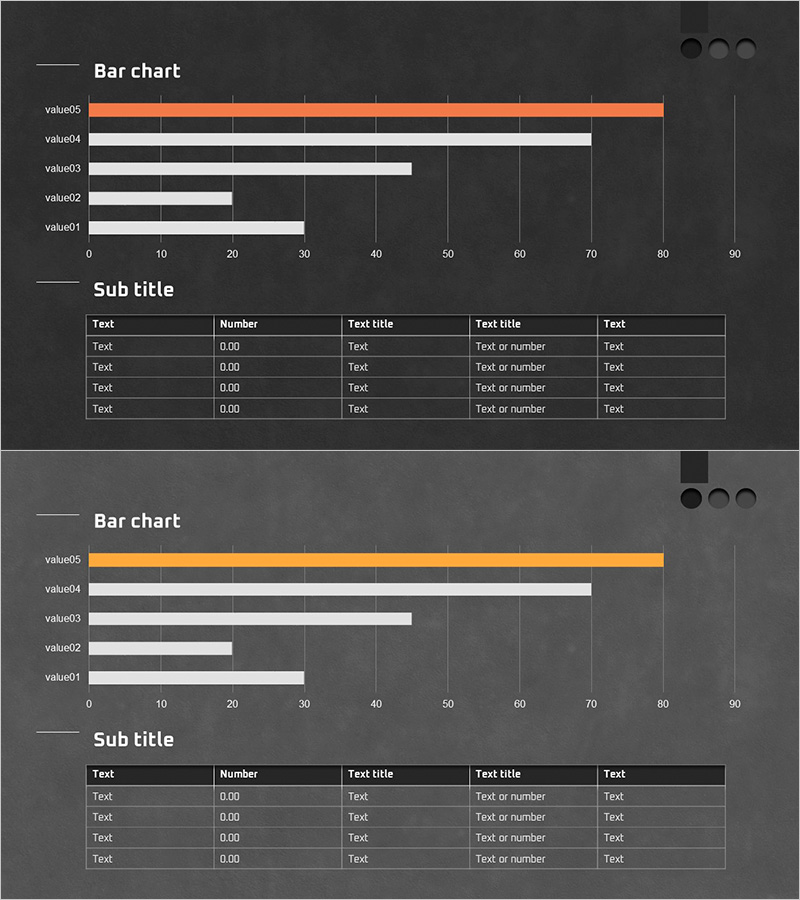
A 2-slide PowerPoint presentation combining market analysis and financial performance visualization. The first slide displays a horizontal bar chart comparing 5 data items, with an orange accent bar and gray background bars that clearly distinguish data hierarchy. The second slide features an income statement table for organizing financial metrics. In 16:9 widescreen PPTX format, fully editable and ready to use in executive reports, business performance presentations, and investor pitch decks where data-driven decision-making is essential.
Usage Points
-
Main Usage
Visualize business performance, financial metrics, and market analysis data numerically to establish clear decision-making foundations. The horizontal bar chart intuitively compares items, while the income statement table organizes financial details to create a credible, comprehensive report.
-
How to Use
Enter actual values into the 5 bar items on the first slide and modify item labels as needed. Input income statement data into the table cells on the second slide to summarize financial status. Maintain the orange accent bar and gray background for visual consistency throughout.
-
Recommended For
CFOs, finance teams, and executives preparing quarterly or annual performance reports. Also effective for investor presentations, business plan pitches, and consulting proposals where demonstrating both financial health and market competitiveness is critical.
-
Slide Structure
Slide 1: 5-item horizontal bar chart (1 orange accent bar, 4 gray background bars, 0–90 numeric axis, gridlines). Slide 2: 5-row × 5-column income statement table (header row included, text and numeric input fields). 16:9 aspect ratio, PPTX format.
Related Products
-

Sales Profit Analysis Table & Graph – Visualizing Financial Planning and Performance
#Financial Plans and Performance #Diagram #Graph
-

Performance Analysis 3D Bar Chart & Table – Market and Performance Analysis
#Company Introduction #Market and Competitor Analysis #Diagram
-

Key Performance Income Analysis Table – Clear Understanding of Business Performance
#Company Introduction #Financial Plans and Performance #Diagram
-

Green Brown Analysis Table – Visualizing Financial Planning
#Financial Plans and Performance #Diagram #Capital Requirements
