Sales Outlook Comparison Analysis Chart – Market Analysis and Performance
RM0600007_22
- Last Update 02/25/2025
- File Size 0.4MB
- # of Slides 2
- File Format PPTX
- Slide Ratio 16:9
- Color
Keywords
- #Content-Based Slides
- #Design-Based Slides
- #Market and Competitor Analysis
- #Financial Plans and Performance
- #Diagram
- #Graph
- #Future Outlook
- #Sales and Revenue
- #Table
- #Horizontal Bar
- #Horizontal Bar Chart
- #16:9
- #horizontal bar chart PowerPoint
- #sales comparison chart template
- #4-product bar graph slide
- #financial analysis presentation
- #market analysis PowerPoint slide
About the Product
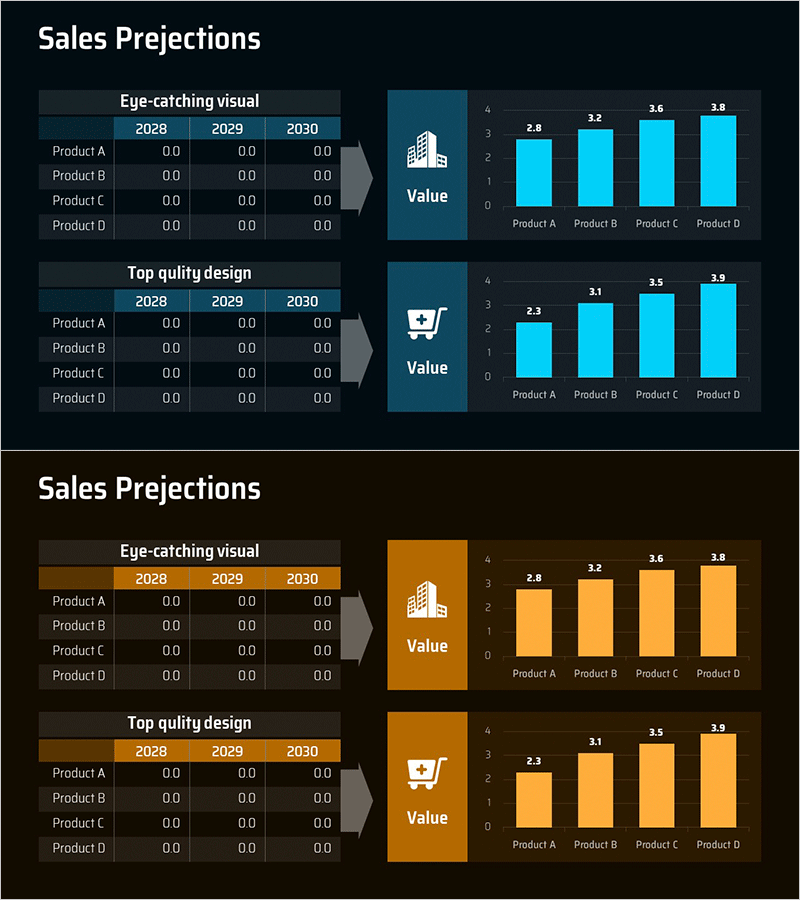
A horizontal bar chart PowerPoint slide designed for sales projections and market analysis presentations. This template features a data input table and corresponding visualization chart comparing four products across three years (2028, 2029, 2030). The dark blue background with bright cyan bars clearly displays numerical comparisons, while building and shopping cart icons reinforce business context. The 2-slide set is ready to use for financial planning, competitive analysis, and performance reporting presentations.
Usage Points
-
Main Usage
Enables quantitative comparison of product sales performance across years and provides instant market positioning insights. Combines data table accuracy with chart visual impact, ideal for financial planning, performance reporting, and competitive analysis sections.
-
How to Use
First slide contains a data input table (3 years × 4 products) that auto-links to the second slide's chart. Simply enter your values and the bar lengths adjust automatically—no additional editing required for immediate presentation use.
-
Recommended For
Finance and marketing team reports, quarterly and annual performance reviews, investor pitch presentations, business plan market analysis sections, competitive benchmarking documentation, and executive-level performance briefings.
-
Slide Structure
Slide 1: Data input table with 4 rows (Product A–D) and 3 columns (2028, 2029, 2030) / Slide 2: Horizontal bar chart displaying the same data with 4 bars (Y-axis 0–4, value labels on each bar, dark blue background, bright cyan bars, 2 business icons)
Related Products
-

Sales Outlook Table & Bar Chart – Market and Financial Insights
#Market and Competitor Analysis #Financial Plans and Performance #Diagram
-

Sales Outlook Analysis Chart – Sleek Data Visualization
#Market and Competitor Analysis #Financial Plans and Performance #Diagram
-

Sales and Profit Analysis Tables & Graphs – Data-Driven Insights
#Market and Competitor Analysis #Financial Plans and Performance #Diagram
-

Bar Chart & Income Statement Table – Market Analysis and Financial Performance
#Market and Competitor Analysis #Financial Plans and Performance #Diagram
