Sales Profit Analysis Table & Graph – Visualizing Financial Planning and Performance
RJ0400059_20
- Last Update 06/03/2025
- File Size 13.1MB
- # of Slides 2
- File Format PPTX
- Slide Ratio 16:9
- Color
Keywords
- #Content-Based Slides
- #Design-Based Slides
- #Financial Plans and Performance
- #Diagram
- #Graph
- #Income Statement
- #Sales and Revenue
- #Table
- #Horizontal Bar
- #Standard Table
- #Horizontal Bar Chart
- #16:9
- #horizontal bar chart PowerPoint
- #sales revenue analysis slide
- #financial planning presentation
- #profit loss statement graph
- #data visualization PowerPoint slide
About the Product
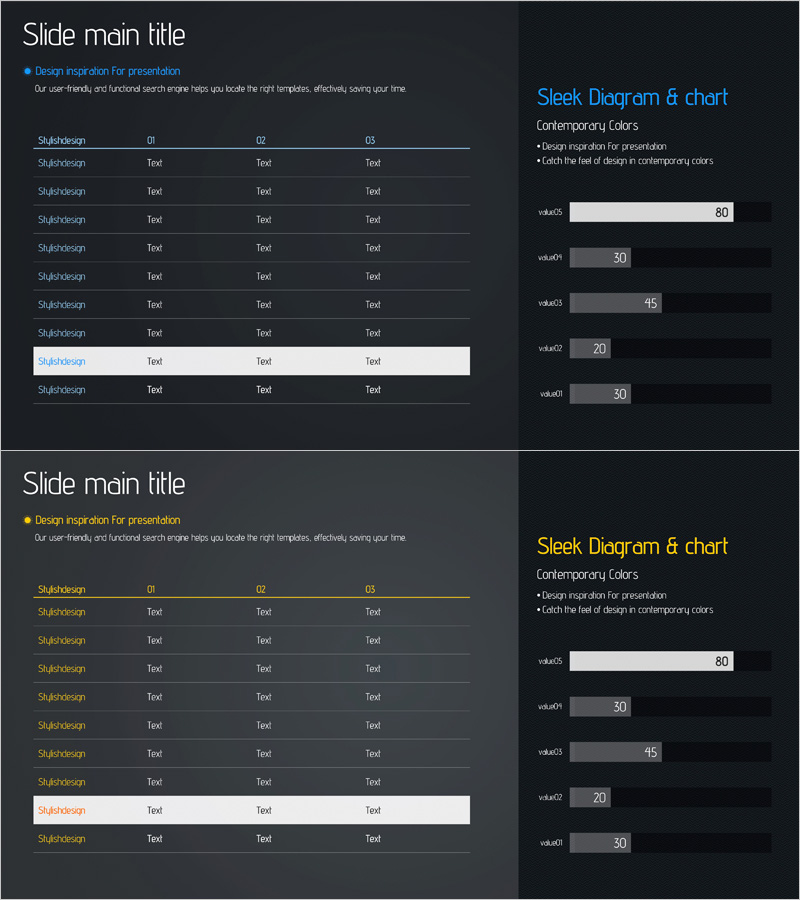
A horizontal bar chart and data table PowerPoint slide that clearly visualizes financial performance. Against a dark background, blue and gray-toned bars compare five revenue and profit data points, while the left table displays detailed figures. This presentation slide is ready to use for financial planning, profit-loss analysis, quarterly performance reports, and business presentations. The 16:9 widescreen format includes two fully editable slides.
Usage Points
-
Main Usage
Presents quarterly or monthly sales revenue status, profit-loss analysis, and financial performance comparisons using horizontal bar charts. Combining table and graph ensures both numerical accuracy and visual impact for stakeholder communication.
-
How to Use
Use in financial reports, business performance presentations, investor briefings, and executive reports to explain sales, revenue, and profit-loss data. Bar length and color emphasize differences between items, enhancing audience comprehension and engagement.
-
Recommended For
Recommended for CFOs, finance managers, business unit directors, executives, and investment officers who need to present financial performance. Ideal for quarterly earnings presentations, annual financial planning sessions, and break-even analysis discussions.
-
Slide Structure
Left table: 6-row, 3-column structure with item names and Q1, Q2, Q3 data entry fields. Right graph: 5-item horizontal bar chart displaying value01 through value05 data. Dark background with blue and gray tones; highlighted rows feature white background.
Related Products
-

Business Income Statement Slide - Highlighting Financial Performance
#Financial Plans and Performance #Diagram #Income Statement
-

Presentation Template Visualizing Business Strategy with Horizontal Bar Graph
#Business Strategy #Financial Plans and Performance #Diagram
-

Business Sales and Profit Calculation Table – Essential Slide for Financial Planning
#Financial Plans and Performance #Diagram #Income Statement
-

Business Income Statement – Visualizing Financial Performance
#Financial Plans and Performance #Diagram #Income Statement
