Sales Outlook Analysis Chart – Sleek Data Visualization
RM0600002_22
- Last Update 02/23/2025
- File Size 1.1MB
- # of Slides 2
- File Format PPTX
- Slide Ratio 16:9
- Color
Keywords
- #Content-Based Slides
- #Design-Based Slides
- #Market and Competitor Analysis
- #Financial Plans and Performance
- #Diagram
- #Graph
- #Future Outlook
- #Sales and Revenue
- #Table
- #Horizontal Bar
- #Horizontal Bar Chart
- #16:9
- #sales projection chart
- #bar chart PowerPoint slide
- #financial data visualization
- #sales analysis presentation
- #comparison chart template
About the Product
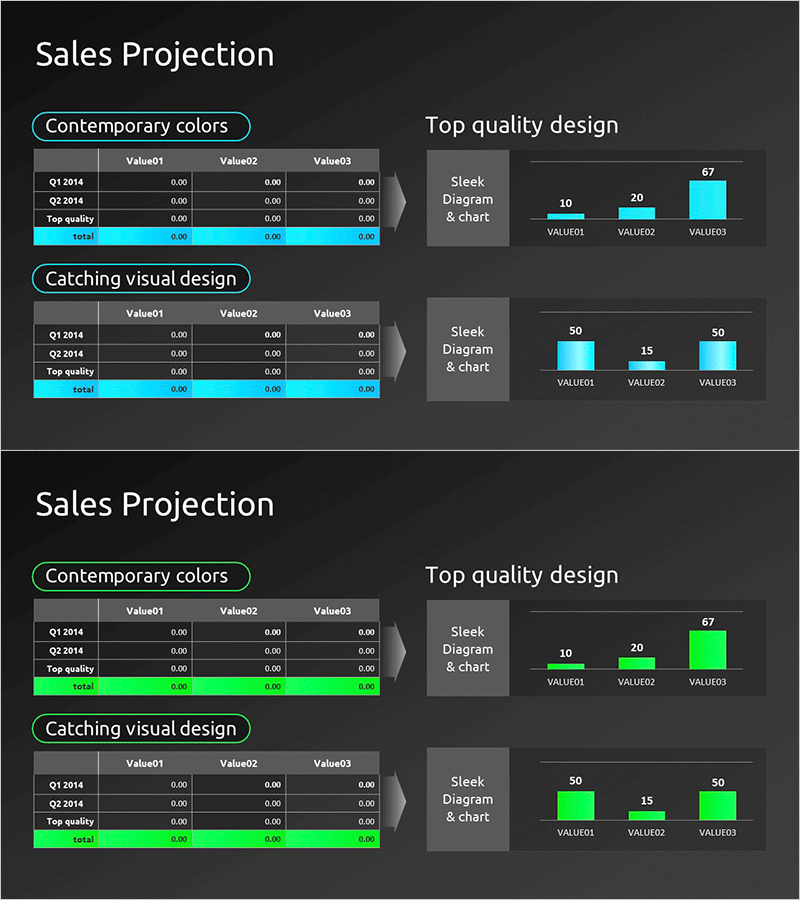
A horizontal bar chart PowerPoint slide designed for clear sales data visualization and quarterly comparison. The dark gray background with cyan accent color creates a professional, minimal layout suitable for financial presentations. Two-slide set includes a data input table at the top and a 3-item bar chart below, ready for immediate use in financial reports, business plans, and marketing presentations. PPTX format in 16:9 widescreen ratio, fully editable in all PowerPoint versions.
Usage Points
-
Main Usage
Compare quarterly, monthly, or departmental sales figures across three items and visually highlight performance differences. The data input table automatically updates the chart, making it ideal for financial analysis, performance reporting, and executive dashboards.
-
How to Use
Enter sales figures for Q1, Q2, Q3, or department names in the top table, and the bar chart below updates automatically. Customize colors, axis labels, and legend using PowerPoint's built-in chart editing tools. Insert directly into presentations, reports, or dashboards.
-
Recommended For
CFOs, financial analysts, business planners, and marketing managers conducting quarterly performance reviews, budget-vs-actual comparisons, and departmental evaluations. Ideal for investor presentations, executive briefings, and team meetings.
-
Slide Structure
Slide 1: Data input table with 3 columns (Value01, Value02, Value03) and 4 rows (Q1 2014, Q2 2014, Top quality, total) positioned above a 3-item horizontal bar chart. Slide 2: Identical structure with lime-green accent color variation. All elements are fully editable vector objects.
Related Products
-

Sales Outlook Table & Bar Chart – Market and Financial Insights
#Market and Competitor Analysis #Financial Plans and Performance #Diagram
-

Sales Outlook Comparison Analysis Chart – Market Analysis and Performance
#Market and Competitor Analysis #Financial Plans and Performance #Diagram
-

Presentation Template Visualizing Business Strategy with Horizontal Bar Graph
#Business Strategy #Financial Plans and Performance #Diagram
-

Successful Business Future Outlook Analysis Graph
#Market and Competitor Analysis #Diagram #Graph
