Future Outlook & Competitor Analysis Chart
RM0300022_17
- Last Update 02/13/2025
- File Size 0.3MB
- # of Slides 2
- File Format PPTX
- Slide Ratio 16:9
- Color
Keywords
- #Content-Based Slides
- #Design-Based Slides
- #Company Introduction
- #Market and Competitor Analysis
- #Diagram
- #Graph
- #Key Achievements
- #Market Analysis
- #Table
- #Horizontal Bar
- #Horizontal Bar Chart
- #16:9
- #competitor analysis chart PowerPoint
- #market outlook graph
- #business analysis slide template
- #horizontal bar chart presentation
- #competitive landscape visualization
- #data-driven PowerPoint slide download
About the Product
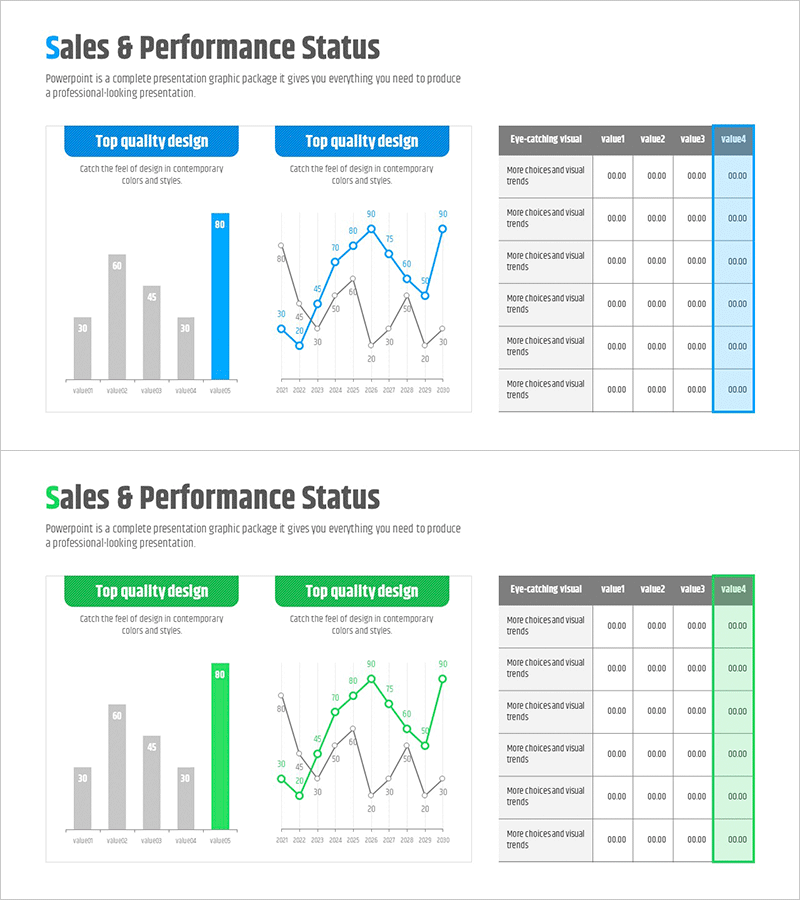
A comprehensive PowerPoint slide combining horizontal bar charts and line graphs to visualize competitor positioning and market trends simultaneously. This presentation template enables clear comparison of competitive landscape with future outlook projections. Ideal for business reports, investor presentations, and strategic planning decks. The 2-slide set features fully editable data fields in PPTX format, allowing quick customization of values and styling for immediate use in corporate presentations.
Usage Points
-
Main Usage
Designed to present quantitative competitor analysis alongside market trend projections. The horizontal bar chart displays key metrics across competitors while the line graph illustrates temporal trends, providing comprehensive evidence for strategic decision-making and competitive positioning discussions.
-
How to Use
Deploy in business reports' market analysis sections, investor pitch decks' competitive advantage narratives, and marketing strategy presentations' market overview segments. Replace chart data with your metrics and customize colors to match corporate branding. Fully editable layout accommodates various data ranges and presentation contexts.
-
Recommended For
Business executives, strategy managers, marketing professionals, management consultants, and investor relations teams presenting competitive analysis and market forecasts. Particularly effective for board-level discussions, investor meetings, and strategic planning sessions requiring quantitative competitive intelligence.
-
Slide Structure
Two-slide template. Slide 1 features a gray-background horizontal bar chart comparing 5 competitor metrics (value1-value5). Slide 2 displays a line graph with blue accent lines tracking 2 data series across monthly periods (2021-2030). Editable data table positioned on the right side of each slide for quick value updates.
Related Products
-

Key Business Performance Analysis Chart – A Measure of Trust
#Company Introduction #Market and Competitor Analysis #Diagram
-

Performance Analysis 3D Bar Chart & Table – Market and Performance Analysis
#Company Introduction #Market and Competitor Analysis #Diagram
-

Key Performance Comparison Analysis Bar Graph
#Company Introduction #Market and Competitor Analysis #Diagram
-

Performance Advantage Analysis Chart – Evolving Business Success
#Company Introduction #Market and Competitor Analysis #Diagram
