Successful Business Future Outlook Analysis Graph
RM0300023_17
- Last Update 02/13/2025
- File Size 0.2MB
- # of Slides 2
- File Format PPTX
- Slide Ratio 16:9
- Color
Keywords
- #Content-Based Slides
- #Design-Based Slides
- #Market and Competitor Analysis
- #Diagram
- #Graph
- #Future Outlook
- #Market Analysis
- #Table
- #Horizontal Bar
- #Horizontal Bar Chart
- #16:9
- #line chart PowerPoint slide
- #performance analysis presentation template
- #future outlook graph
- #market analysis chart
- #bar graph PowerPoint slide
- #upward trend presentation
- #how to create trend chart in PowerPoint
About the Product
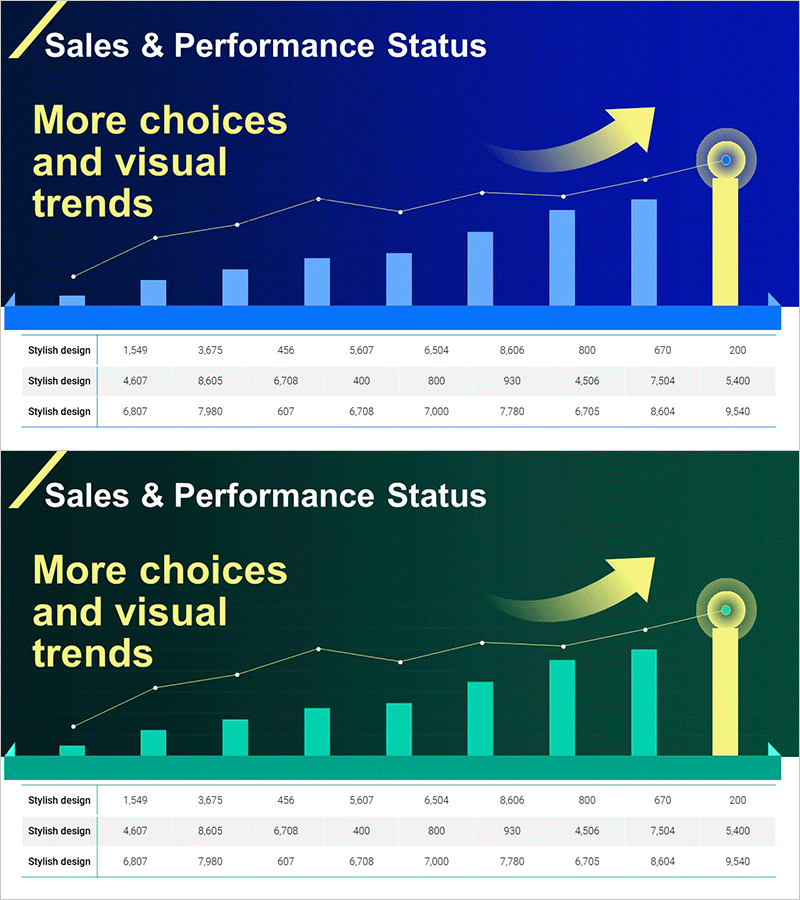
A 2-slide PowerPoint presentation template for visualizing corporate future outlook and market analysis. The design features a dark blue background with light blue bar graphs, a golden upward arrow, and white trend line that emphasize growth momentum. Nine data points clearly represent quarterly or monthly performance changes, with a 3-row data table below for detailed numerical reference. This presentation slide is ready to use in performance analysis sections of business reports, proposals, and pitch decks.
Usage Points
-
Main Usage
Visualizes time-series data such as quarterly/monthly revenue, customer count, or market share growth. The combination of trend line and bar graph enables both overall flow comprehension and point-by-point value comparison, enhancing data credibility. The upward arrow and golden accent effectively communicate positive performance outcomes.
-
How to Use
Use in business report performance sections, quarterly results presentations, and investor pitch decks to demonstrate growth potential. Input actual figures in the bottom table and link to the chart for automatic updates. Colors and fonts are fully editable to match corporate branding guidelines.
-
Recommended For
CFOs and finance managers presenting financial results to executives, marketing teams quantifying campaign effectiveness, and sales teams visualizing quarterly targets. Ideal for startup investment pitches, corporate business reports, and consulting proposals where data credibility is critical.
-
Slide Structure
2-slide set: First slide features dark blue background with 9-point white trend line, light blue bar graph (9 items), golden upward arrow, and circular accent icon. Second slide uses identical layout with dark green background. Both include 3-row × 10-column data entry table at bottom for numerical input.
Related Products
-

Key Business Performance Analysis Chart – A Measure of Trust
#Company Introduction #Market and Competitor Analysis #Diagram
-

Bar Chart & Income Statement Table – Market Analysis and Financial Performance
#Market and Competitor Analysis #Financial Plans and Performance #Diagram
-

Market Trend Analysis Charts & Tables – The Power of Data Visualization
#Market and Competitor Analysis #Diagram #Graph
-

Blue Red Analysis Chart – New Insights into Market Analysis
#Market and Competitor Analysis #Diagram #Graph
