Income Statement Table – Visualizing Financial Performance
RM0600007_25
- Last Update 02/25/2025
- File Size 0.2MB
- # of Slides 2
- File Format PPTX
- Slide Ratio 16:9
- Color
Keywords
- #Content-Based Slides
- #Design-Based Slides
- #Financial Plans and Performance
- #Diagram
- #Income Statement
- #Cash Flow Statement
- #Table
- #16:9
- #income statement PowerPoint slide
- #financial table presentation
- #how to make an income statement in PowerPoint
- #financial comparison slide
- #income statement template
About the Product
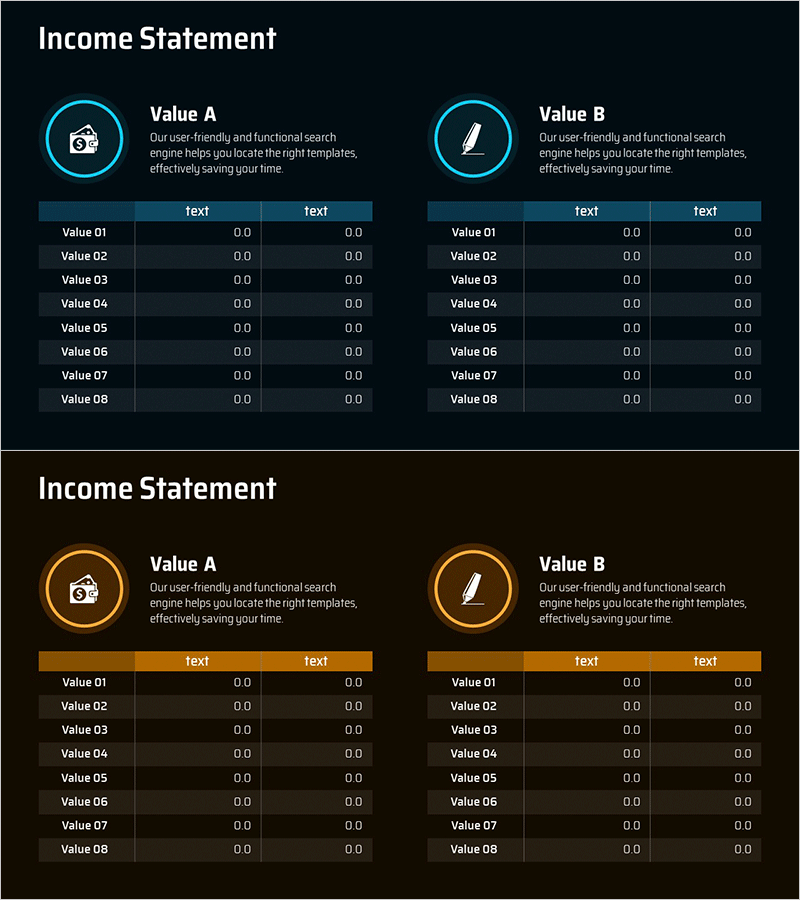
A professional income statement PowerPoint slide designed to visualize financial performance with clarity and impact. This 2-slide set features a dark navy background with blue and gold accent colors, offering two distinct layout variations for different presentation contexts. Each slide includes Value A and Value B comparison sections with an 8-row data table (Value 01 through Value 08) for entering financial metrics, revenue figures, expense breakdowns, or budget comparisons. The 16:9 widescreen PPTX format is fully editable and ready to use immediately in corporate presentations, investor meetings, financial reports, and quarterly earnings briefings.
Usage Points
-
Main Usage
Present financial performance, profit and loss data, and revenue metrics to investors, executives, and stakeholders with a structured, data-driven approach. The dual-section table layout enables side-by-side comparison of financial periods, departments, or scenarios while maintaining professional credibility and visual clarity.
-
How to Use
Enter your actual financial figures into the Value 01–Value 08 rows and the two data columns. Use the blue layout for conservative, trust-focused corporate presentations and the gold layout for growth-oriented or premium investor relations materials. All colors, fonts, and table styling can be customized to match your corporate brand guidelines.
-
Recommended For
CFOs, finance managers, and executives presenting quarterly or annual financial results. Ideal for investor pitches, earnings calls, board meetings, and financial disclosure presentations. Suitable for startups seeking funding, public companies filing financial reports, and consulting firms delivering financial analysis to clients.
-
Slide Structure
Both slides follow an identical structure: title (Income Statement) at the top, two icon-labeled sections (Value A and Value B) with descriptive text, and an 8-row by 2-column data table below. Each table row represents a financial metric (Value 01–Value 08) with two numeric input columns for direct comparison analysis.
Related Products
-

Activity Time & Calorie Burn Table – Structure for Financial Performance
#Financial Plans and Performance #Diagram #Income Statement
-

Green Blue Standard Table – Visualizing Financial Plans
#Financial Plans and Performance #Diagram #Income Statement
-

Balloon Pile Table Chart – Communicating Financial Performance
#Financial Plans and Performance #Diagram #Income Statement
-

Year-over-Year Comparison Income Statement – Financial Performance Analysis
#Financial Plans and Performance #Diagram #Income Statement
