Timeline Chart Visualizing Yearly Changes – Journey of Success
RB0800028-1_6
- Last Update 03/23/2025
- File Size 0.2MB
- # of Slides 2
- File Format PPTX
- Slide Ratio 4:3
- Color
Keywords
- #Content-Based Slides
- #Design-Based Slides
- #Company Introduction
- #Operational Plan
- #Diagram
- #History
- #Project Implementation Schedule
- #Flow
- #Cluster
- #Linear Flow
- #Chain Diagram
- #4:3
- #timeline chart PowerPoint
- #yearly progress slide
- #stage diagram presentation
- #project milestone template
- #timeline visualization PPT
About the Product
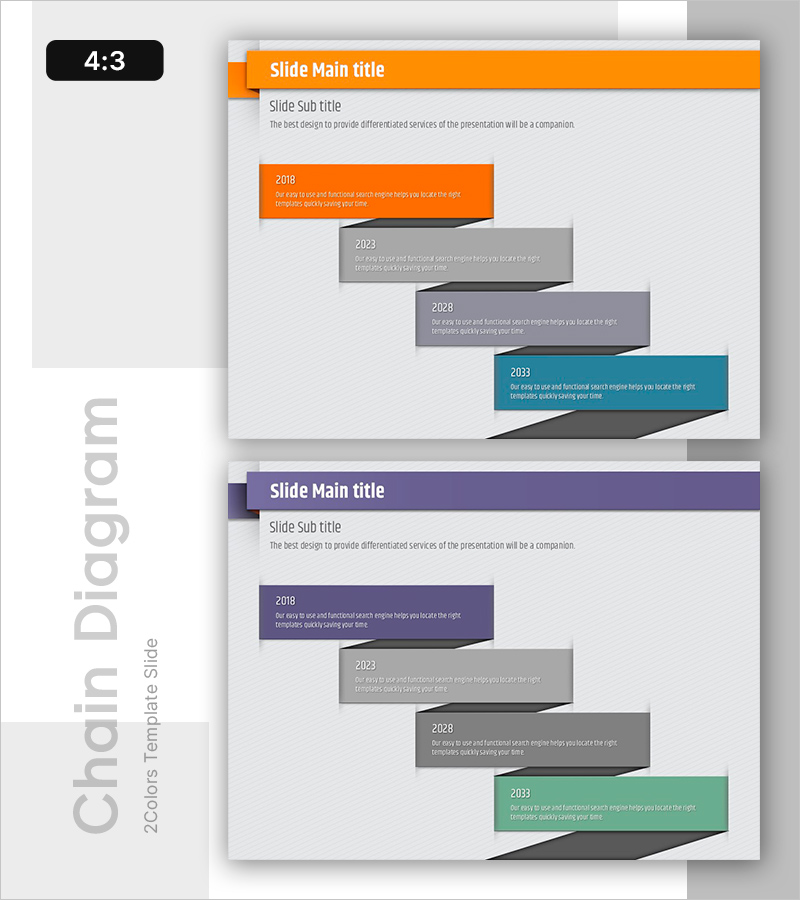
A timeline chart PowerPoint slide that clearly displays yearly changes and stage-by-stage progress. Four color-coded boxes (orange, gray, gray, and teal) flow rightward to represent different years, with editable text areas for each stage's achievements and details. Ideal for business progress presentations, project milestones, annual growth trends, and any timeline-based narrative. The 4:3 aspect ratio, 2-slide template is ready for immediate customization and editing.
Usage Points
-
Main Usage
Designed to visually represent time-based progress, yearly achievements, and project milestones. Each year box accommodates specific accomplishments, goals, and initiatives, enabling clear communication of business development and strategic progression.
-
How to Use
Double-click the text area in each year box (2018, 2023, 2028, 2033) to enter corresponding achievements, plans, or targets. Colors can remain as preset (orange, gray, teal) or be customized. Box sizes and positioning are fully adjustable to match your presentation needs.
-
Recommended For
Recommended for business plans, annual reports, and investor pitch decks showcasing company growth or project timelines. Also suitable for project management presentations, product development roadmaps, organizational change narratives, and any presentation requiring time-axis-based information delivery.
-
Slide Structure
2-slide template featuring an orange header on the first slide with 4 year boxes (orange, gray, gray, teal) flowing rightward, and a purple header on the second slide with identical timeline structure. Each box contains year labels and editable text areas for descriptions.
Related Products
-

Business Promotion Schedule Diagram – A Stepwise Approach to Success
#Company Introduction #Operational Plan #Diagram
-

Chronological Slide Visualizing Design Evolution – The Journey of Design
#Company Introduction #Operational Plan #Diagram
-

History Vertical Arrow Diagram – Business Flow Visualization
#Company Introduction #Diagram #History
-

History of Past Businessmen Presentation Template - Visualizing the Flow of Time
#Company Introduction #Product/Service Introduction #Diagram
