Business Infrastructure Circular Diagram – Efficiency and Innovation
RM0500010_11
- Last Update 02/22/2025
- File Size 0.4MB
- # of Slides 2
- File Format PPTX
- Slide Ratio 16:9
- Color
Keywords
- #Content-Based Slides
- #Design-Based Slides
- #Business Introduction
- #Technical Approach
- #Diagram
- #Infrastructure
- #System Architecture Diagram
- #Flow
- #Circular Flow
- #16:9
- #circular diagram PowerPoint
- #3-step cycle slide template
- #business infrastructure diagram
- #circular flow presentation
- #how to create circular diagram in PowerPoint
- #PowerPoint diagram slide download
About the Product
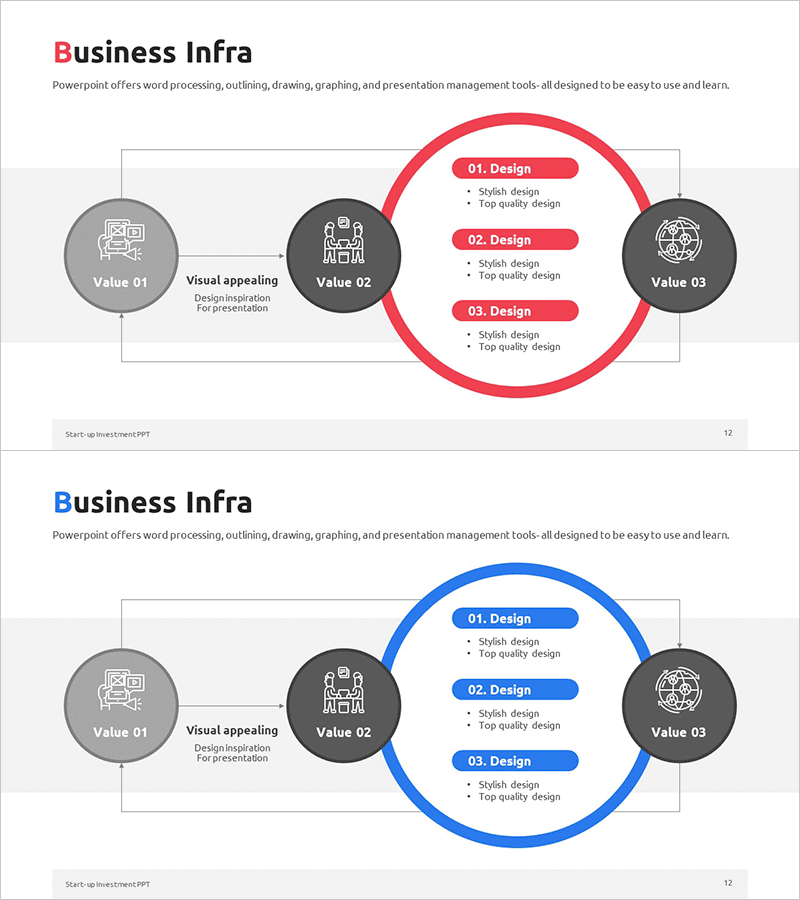
A PowerPoint slide template featuring a circular diagram with three interconnected nodes (Value 01, 02, 03) representing business infrastructure elements. The design includes a central circular area with three design items and connecting arrows showing cyclical flow. Available in both red and blue color versions, each node contains an icon and descriptive text. The 16:9 widescreen format includes 2 fully editable slides suitable for business presentations, strategy discussions, and organizational value communication.
Usage Points
-
Main Usage
Illustrate interconnected business concepts, organizational values, or strategic elements through a cyclical structure that emphasizes continuous flow and mutual relationships. Ideal for explaining business models, organizational culture, process cycles, and strategic frameworks in executive presentations.
-
How to Use
Replace the three central items with your own content. Customize node labels and icons to match your organizational context. Select either the red or blue version to align with corporate branding. Modify text placement and add or remove nodes as needed for your presentation requirements.
-
Recommended For
Executive teams, strategy departments, marketing teams, and HR professionals presenting business models, organizational restructuring, strategic initiatives, and company culture. Suitable for company introductions, business plans, annual reports, and training materials requiring cyclical process visualization.
-
Slide Structure
Both slides feature identical layout: three circular nodes on the left (icon + label + description), large central circular area with three editable items, and one node on the right. Red version uses red accents for the central circle and item labels; blue version uses blue. Connecting lines and arrows indicate cyclical flow between nodes.
Related Products
-

Business Process Pentagon 3D Diagram – Visualizing Operational Plans
#Operational Plan #Technical Approach #Diagram
-

IoT System Configuration Diagram – Innovation Through Connection
#Business Introduction #Technical Approach #Diagram
-

Step-by-step System Configuration Diagram – Business Strategy
#Business Strategy #Technical Approach #Diagram
-

Securities Service System Structure – Systematic Flow Diagram
#Technical Approach #Diagram #Service Components
