Securities Service System Structure – Systematic Flow Diagram
RM0200004_20
- Last Update 02/02/2025
- File Size 0.2MB
- # of Slides 2
- File Format PPTX
- Slide Ratio 16:9
- Color
Keywords
About the Product
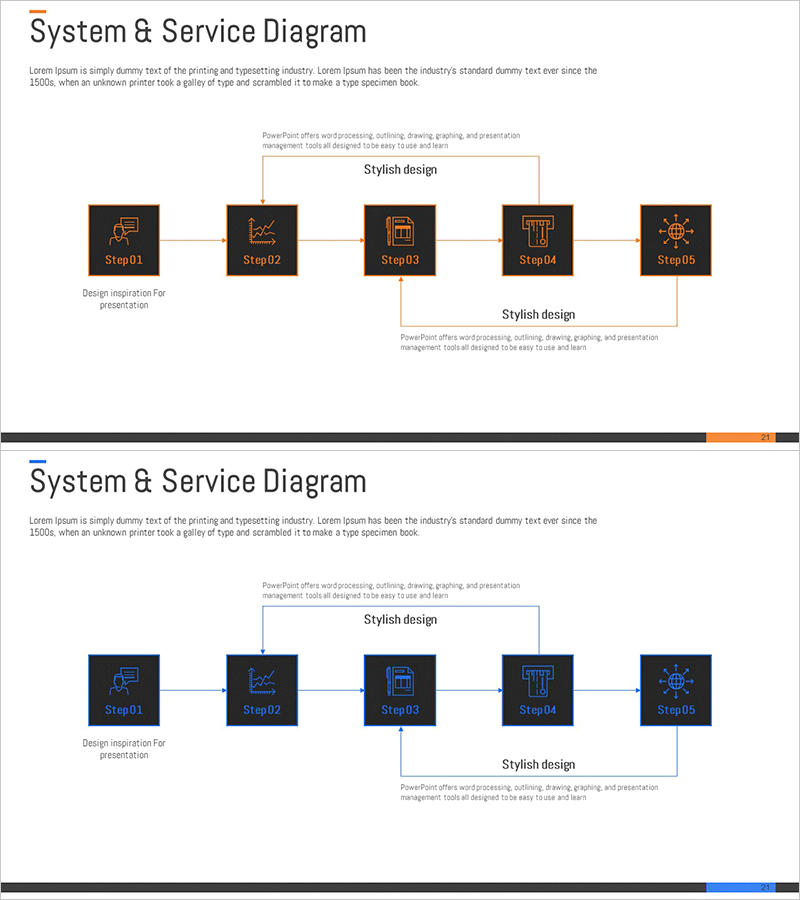
A circular flow diagram PowerPoint slide that visualizes the step-by-step process of a securities and financial service system using five nodes. This PPT template features a black background with orange icons and connecting lines, representing the systematic progression from design inspiration to final implementation. Each stage (Step01 through Step05) represents a distinct functional area, with editable text boxes above and below for additional information. Composed of 2 slides in 16:9 widescreen format, this presentation template is ready for immediate use in technical presentations, system architecture explanations, and service structure documentation.
Usage Points
-
Main Usage
Clearly visualizes the system architecture and step-by-step processes of financial and securities services. The five-node circular structure is ideal for representing repetitive processes, continuous improvement cycles, or sequential workflows. Serves as a key tool for technical team presentations, system design documentation, and service architecture diagrams.
-
How to Use
Replace the icons and text in each Step box with your own system stage names. Edit the 'Stylish design' text areas at the top and bottom to include stage descriptions, responsible departments, or timeframes. Adjust arrow directions between nodes or modify colors as needed to emphasize specific elements.
-
Recommended For
Ideal for technology teams, system architects, IT consultants, and product managers at financial, securities, and fintech companies presenting system structures. Also suitable for university lectures, technical seminars, and internal training materials.
-
Slide Structure
Two-slide composition featuring five black square nodes (Step01–Step05) arranged horizontally in a line, connected by orange arrows in a circular pattern. Title box labeled 'Stylish design' at the top with additional explanation text area at the bottom. First slide includes orange accent line; second slide features blue accent line for color variation.
Related Products
-

Food Chain Cycle Diagram – Capturing Nature's Cycle
#Technical Approach #Diagram #Service Components
-

Business Circular Diagram – Expressing Service Execution Plans
#Technical Approach #Diagram #Service Components
-

Business Infrastructure Circular Diagram – Efficiency and Innovation
#Business Introduction #Technical Approach #Diagram
-

Future Technology System Configuration Diagram – Efficient Development Flow
#Business Management #Technical Approach #Diagram
