Step-by-step System Configuration Diagram – Business Strategy
RM0200002_20
- Last Update 02/01/2025
- File Size 0.6MB
- # of Slides 2
- File Format PPTX
- Slide Ratio 16:9
- Color
Keywords
- #Content-Based Slides
- #Design-Based Slides
- #Business Strategy
- #Technical Approach
- #Diagram
- #Step-by-Step Schedule Plan
- #System Architecture Diagram
- #Flow
- #Circular Flow
- #16:9
- #circular diagram PowerPoint
- #5-step system configuration diagram
- #business strategy PowerPoint slide
- #process flow diagram slide
- #cycle diagram PPT template
About the Product
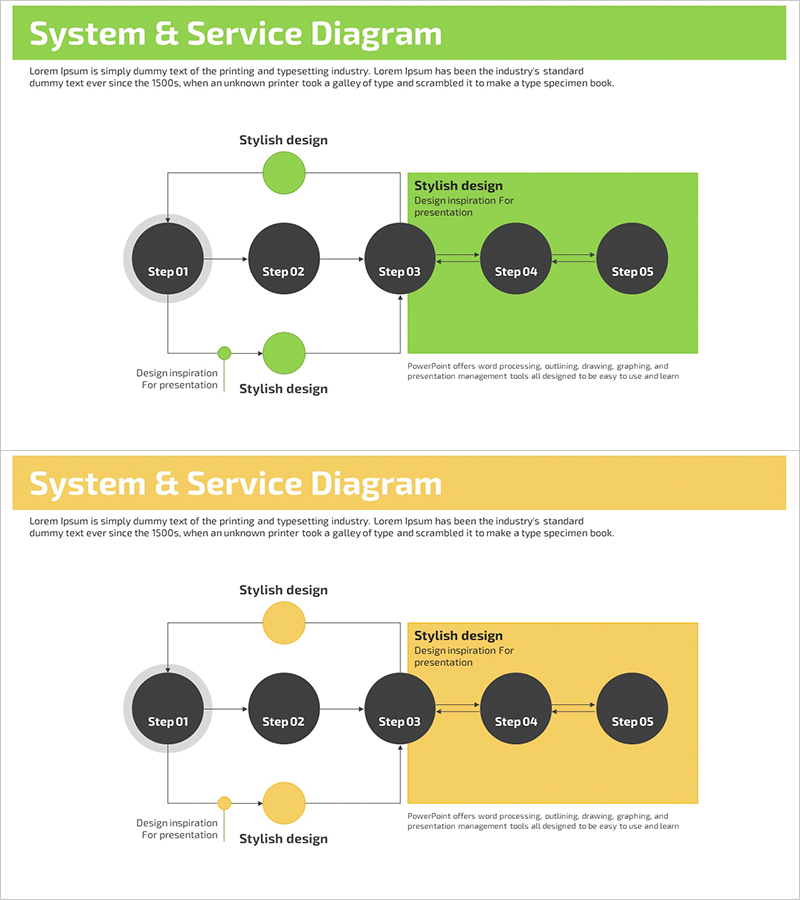
A PowerPoint slide that visualizes business strategy and system configuration through a 5-step circular flow diagram. The design combines a lime green background with dark gray circular nodes to clearly represent the connectivity and cyclical structure of each stage. A green circle at the top and bottom indicates feedback loops, while a highlighted box on the right allows for detailed descriptions of each step. The 2-slide set includes both lime green and yellow color versions, enabling you to select the design that best matches your presentation theme and tone. Ideal for presentations, business plans, and system design documents to effectively communicate process flows and strategic progression.
Usage Points
-
Main Usage
Visualize business strategy, system configuration, process flows, and phased planning through a circular structure that clearly demonstrates the connectivity between stages and feedback loops. The linear arrangement of 5 nodes with upper and lower feedback paths creates a complete cycle, effectively communicating iterative processes and continuous improvement strategies.
-
How to Use
Enter stage names (Step 01–05) in each circular node and add detailed descriptions and objectives in the highlighted box on the right. Use the top and bottom green circles as feedback elements or connectors, and customize arrow colors and text to match your organization's brand colors as needed.
-
Recommended For
Executive and strategy team business planning presentations, project managers explaining process flows, system engineers presenting architecture designs, marketing teams outlining campaign phase strategies, and organizational development teams communicating change management and improvement cycles.
-
Slide Structure
2-slide set: 1 slide with lime green background + 1 slide with yellow background. Each slide features 5 dark gray circular nodes (Step 01–05) arranged left to right, with 2 green circles positioned above and below to represent feedback pathways. A highlighted box (lime green or yellow) on the right serves as the description area for the selected stage.
Related Products
-

Visualizing Product Service Differentiation Strategy with Circular Diagram
#Product/Service Introduction #Technical Approach #Diagram
-

Financial Business Process Diagram – Efficient Workflow
#Business Strategy #Operational Plan #Diagram
-

Circular Flow for Business Advancement
#Business Strategy #Operational Plan #Diagram
-

Future Technology System Configuration Diagram – Efficient Development Flow
#Business Management #Technical Approach #Diagram
