Product Development Process Diagram – Efficient Operations Planning
RM0500008_20
- Last Update 02/22/2025
- File Size 0.3MB
- # of Slides 2
- File Format PPTX
- Slide Ratio 16:9
- Color
Keywords
- #Content-Based Slides
- #Design-Based Slides
- #Product/Service Introduction
- #Operational Plan
- #Diagram
- #Development Plan
- #Production and Technology Development Strategy
- #Flow
- #Circular Flow
- #16:9
- #circular diagram PowerPoint
- #3-stage process slide
- #product development diagram
- #cycle process PowerPoint
- #how to create circular diagram in PowerPoint
About the Product
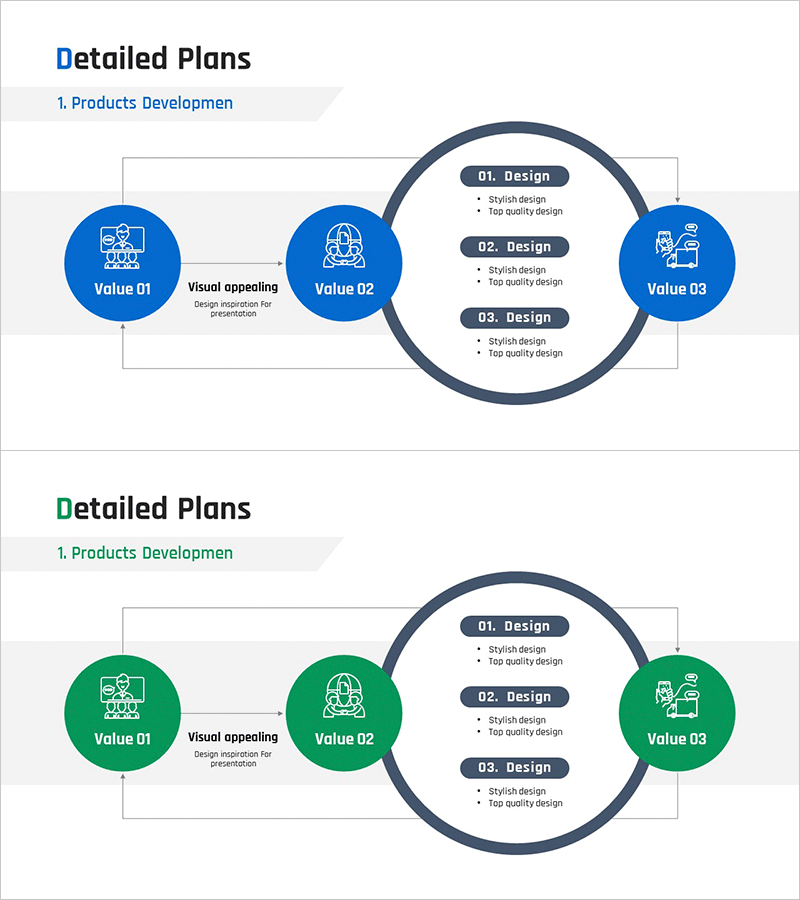
A PowerPoint slide presenting the product development process through a three-stage circular diagram structure. The central circular frame contains three blue nodes (Value 01, Value 02, Value 03) connected by directional arrows, visualizing a continuous cyclical workflow. The design combines navy-blue circular nodes with a dark gray border frame, while detailed design specifications (Stylish design, Top quality design) are organized in a right-aligned box. Formatted in 16:9 widescreen ratio across 2 slides, this template is ready for immediate use in product development, operational planning, and process improvement presentations.
Usage Points
-
Main Usage
Clearly visualizes the iterative cyclical process of product development, enhancing team comprehension. Emphasizes the continuous cycle of planning→design→improvement while organizing key activities by stage in box format to maximize information delivery efficiency.
-
How to Use
Apply to product development strategy presentations, operational process explanations, and quality management planning sessions. Simply replace node text with your process stage names and edit the right-side box details with specific activities for immediate deployment.
-
Recommended For
Ideal for product development teams, operations managers, project leaders, and quality assurance professionals presenting process improvements or team training materials. Effective for startup product roadmap presentations and enterprise operational efficiency reports.
-
Slide Structure
2-slide composition featuring a central circular frame with 3 blue nodes (Value 01/02/03) and connecting lines on both sides, plus a right-aligned design specification box (01. Design / 02. Design / 03. Design). Directional arrows between nodes clearly express clockwise circulation, optimized for 16:9 aspect ratio display.
Related Products
-

Circular Diagram Slide Visualizing Construction Process and Strategy
#Operational Plan #Diagram #Production and Technology Development Strategy
-

Medicine Development Progress Plan Slide
#Product/Service Introduction #Operational Plan #Diagram
-

Detailed Architectural Design Steps – Flow with Modern Touch
#Product/Service Introduction #Business Strategy #Operational Plan
-

Agricultural Aftercare and Maintenance Strategy Circular Icon
#Operational Plan #Diagram #Production and Technology Development Strategy
