Cost Structure and Margin Analysis Chart – Donut Slide Providing Business Insights
RM0500002_12
- Last Update 02/20/2025
- File Size 1.1MB
- # of Slides 2
- File Format PPTX
- Slide Ratio 16:9
- Color
Keywords
- #Content-Based Slides
- #Design-Based Slides
- #Product/Service Introduction
- #Business Introduction
- #Diagram
- #Graph
- #Development Status
- #Revenue Model
- #Cluster
- #Circles
- #Closed Cluster Diagram
- #Doughnut Chart
- #16:9
- #donut chart PowerPoint
- #pie chart slide template
- #cost structure analysis presentation
- #margin analysis chart
- #business financial template
About the Product
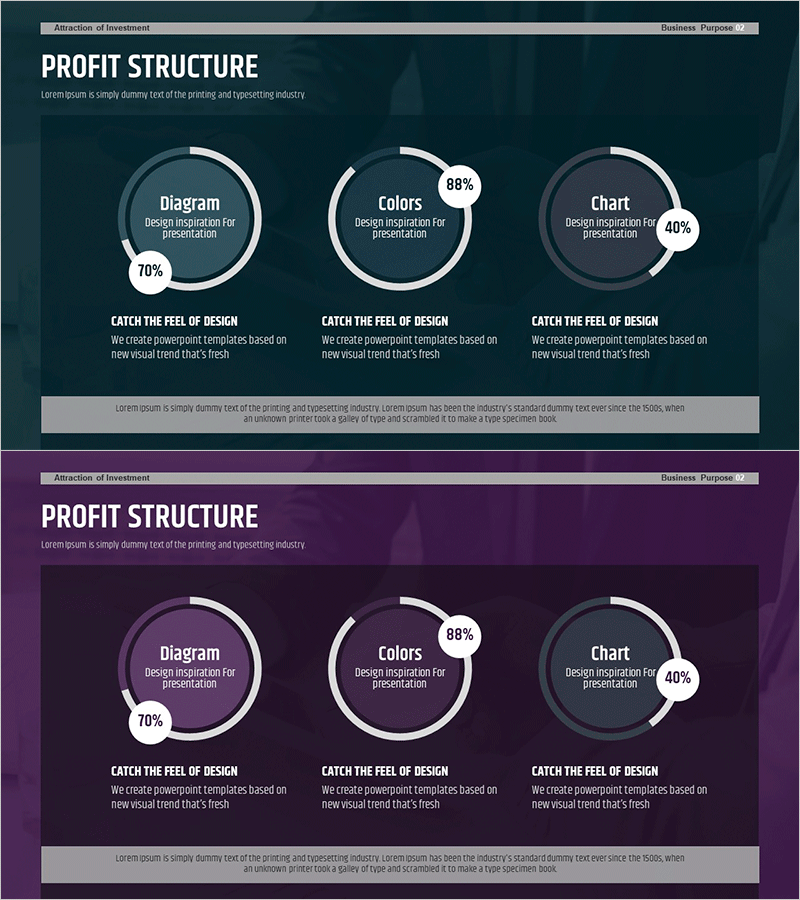
A professional donut chart PowerPoint slide designed for business presentations analyzing cost structure and profit margins. The slide features two donut graphs divided into three segments each, displayed against a dark teal background with white borders and percentage labels for clear data visualization. Each chart section includes descriptive text areas below for detailed explanations of cost components, margin rates, and financial insights. The 2-slide PPTX template in 16:9 widescreen format is fully editable, allowing you to customize colors, percentages, and labels to fit various financial presentations, investor pitches, and executive reports.
Usage Points
-
Main Usage
Visualize financial data such as cost composition, profit margins, revenue breakdown, and expense distribution using donut charts. Ideal for executive presentations, investor meetings, financial analysis reports, and quarterly business reviews.
-
How to Use
Replace the percentage values and labels in each donut segment with your actual financial data. Update the descriptive text boxes below each chart with cost categories, margin percentages, and analytical insights. Adjust colors to differentiate between cost types or highlight key metrics.
-
Recommended For
CFOs, financial analysts, business managers, management consultants, and investment professionals presenting cost analysis, profitability assessments, and margin comparisons to stakeholders.
-
Slide Structure
Two donut charts with 3 segments each on a dark teal background. Percentage labels positioned on chart borders. Text description areas below each chart for detailed explanations. White borders and gray accent elements create a professional business aesthetic suitable for formal presentations.
Related Products
-

Investment Profit Structure Donut Chart
#Product/Service Introduction #Business Introduction #Diagram
-

Automotive Technology Revenue Model Analysis Chart – Modern and Sleek Design
#Product/Service Introduction #Business Introduction #Diagram
-

Corporate Profit Structure Analysis Donut Chart
#Product/Service Introduction #Business Introduction #Diagram
-

Effective Use of Space Development Donut Circle Graph
#Product/Service Introduction #Business Introduction #Diagram
