Pie Chart of Shooting Status Analysis – Visual Insights
RM0200014_17
- Last Update 02/05/2025
- File Size 0.3MB
- # of Slides 2
- File Format PPTX
- Slide Ratio 16:9
- Color
Keywords
- #Content-Based Slides
- #Design-Based Slides
- #Product/Service Introduction
- #Market and Competitor Analysis
- #Diagram
- #Graph
- #Development Status
- #Market Analysis
- #Cluster
- #Circles
- #Closed Cluster Diagram
- #Doughnut Chart
- #16:9
- #donut pie chart PowerPoint
- #pie chart slide template
- #data visualization PPT
- #ratio chart PowerPoint
- #how to create pie chart in PowerPoint
About the Product
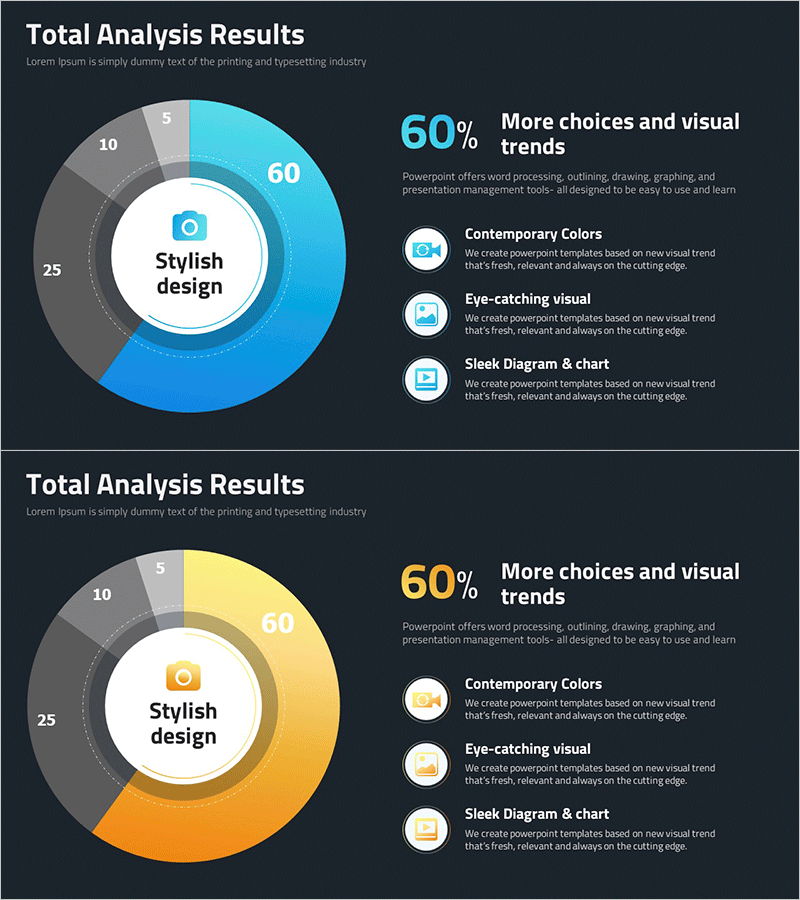
A donut pie chart PowerPoint slide designed for shooting status analysis and data comparison. The slide features a central circular area displaying key metrics (60%) with an outer ring divided into four color-coded segments representing proportional data. The design uses cyan, orange, and gray gradient tones to clearly distinguish each category, optimized for 16:9 widescreen format in a 2-slide set. This PowerPoint chart template is ready to use for marketing reports, business analysis, market overview presentations, and data-driven communications where ratio visualization is essential.
Usage Points
-
Main Usage
Effectively communicate proportional data such as market share, budget allocation, customer segments, or shooting status breakdown. The central circular area emphasizes key metrics while the outer ring displays detailed categories, allowing audiences to grasp both overall context and specific segment information simultaneously.
-
How to Use
Insert this slide into marketing reports, business analysis presentations, market overview decks, and financial summaries where ratio comparison is needed. Easily customize the data values, category labels, and colors through the slide master to match your specific dataset. The template automatically adapts to 16:9 widescreen displays.
-
Recommended For
Ideal for marketing teams, business analysts, sales professionals, and executives preparing data-driven presentations. Particularly effective for market analysis, customer segmentation, budget distribution, and product portfolio composition. Suitable for quarterly reports, performance reviews, investor presentations, and strategic planning meetings.
-
Slide Structure
2-slide set with title area and donut chart on the first slide, and expanded chart view with legend details on the second. The donut design features a central circle (displaying 60% metric) and outer ring divided into 4 color-coded segments (cyan, orange, gray, light tone) with percentage labels for each category.
Related Products
-

Vaccine Research Status Graph – Market and Competitive Analysis
#Market and Competitor Analysis #Diagram #Graph
-

Business Investment Market Analysis Donut Graph
#Product/Service Introduction #Market and Competitor Analysis #Diagram
-

Port Transport Data & Comparison Chart – Optimized for Market and Competitor Analysis
#Product/Service Introduction #Market and Competitor Analysis #Graph
-

Medical System Configuration Graph – Infographic for Market Analysis
#Product/Service Introduction #Market and Competitor Analysis #Diagram
