Global Market Entry & Data-Based Market Analysis Chart
RM0500006_10
- Last Update 02/21/2025
- File Size 1.4MB
- # of Slides 2
- File Format PPTX
- Slide Ratio 16:9
- Color
Keywords
- #Content-Based Slides
- #Design-Based Slides
- #Company Introduction
- #Market and Competitor Analysis
- #Graph
- #Other
- #Global Network
- #Market Status
- #Horizontal Bar
- #Segmented Horizontal Bar
- #Map
- #16:9
- #world map PowerPoint slide
- #global market analysis presentation
- #market expansion strategy PPT
- #stacked bar chart slide
- #geographic data visualization template
About the Product
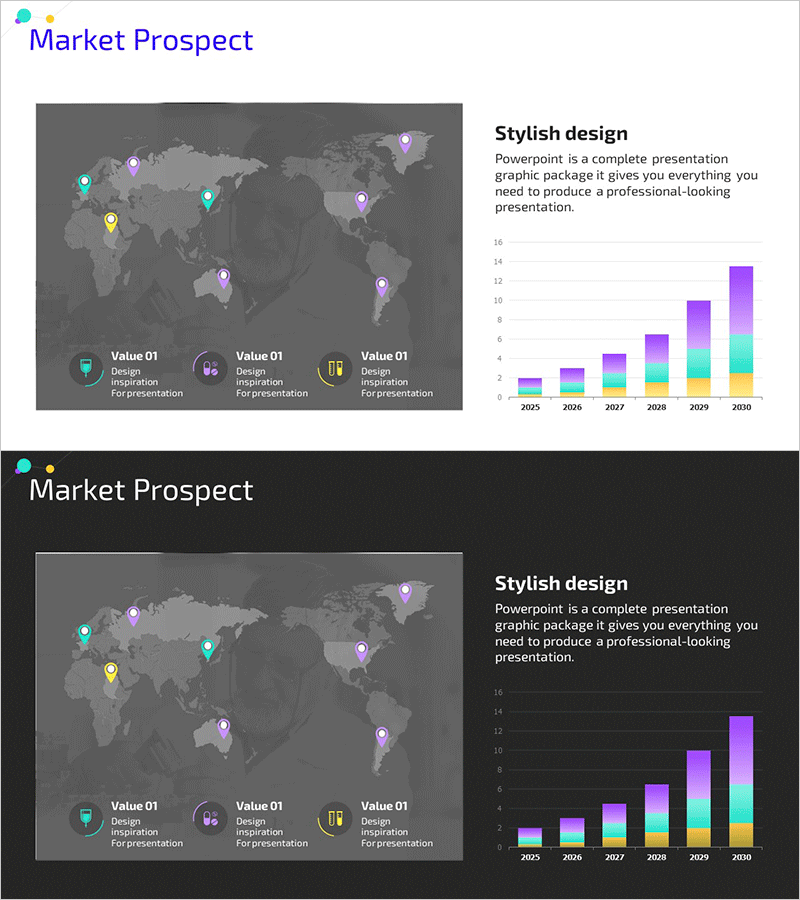
A 2-slide PowerPoint presentation set designed for global market entry and data-driven market analysis. The first slide features a world map with location pins marking regional markets and global network distribution across six continents. The second slide visualizes market data from 2005 to 2030 using a stacked column chart with four data series in cyan, green, orange, and purple, clearly showing growth trends over time. Set against a dark gray background, the color-coded data series creates strong visual contrast for professional presentations. Formatted in 16:9 widescreen ratio optimized for modern displays and saved as PPTX for full compatibility with all PowerPoint versions and easy customization.
Usage Points
-
Main Usage
Effectively communicate global market opportunities to executives and investors by simultaneously displaying regional market locations via world map pins and temporal growth data through stacked column charts. The combination of geographic and time-series visualization enables stakeholders to grasp market potential at a glance.
-
How to Use
Integrate into business plans, investor pitch decks, and market analysis reports within the market overview section. Customize pin locations and chart data to reflect your company's actual performance and target markets. Easily edit all elements to match your corporate branding and specific market data.
-
Recommended For
Ideal for executives, business development teams, marketing departments, and investor relations professionals presenting global expansion strategies. Particularly effective when explaining new market entry decisions, international subsidiary establishment plans, and cross-border business performance reports that require simultaneous regional and temporal data communication.
-
Slide Structure
Slide 1: Dark gray background with world map displaying six regional market pins in cyan, purple, orange, and yellow colors connected by lines representing global network structure and market distribution. Slide 2: Market data spanning 2005–2030 across six years visualized as stacked column chart with four data series (cyan, green, orange, purple) showing cumulative growth, accompanied by three category legend icons on the right side.
Related Products
-

Fantastic Wide PowerPoint Map & Bar Chart
#Company Introduction #Market and Competitor Analysis #Graph
-

Global Market Outlook Analysis – Diagram Based Presentation
#Company Introduction #Market and Competitor Analysis #Diagram
-

Global Business Market Outlook Circular Diagram
#Company Introduction #Market and Competitor Analysis #Diagram
-

Media Utilization Graph – Visualizing Market Trends
#Company Introduction #Market and Competitor Analysis #Other
