Business Solutions Analysis Graph – The Optimal Tool for Market Analysis
RJ0300084_16
- Last Update 05/12/2025
- File Size 0.3MB
- # of Slides 2
- File Format PPTX
- Slide Ratio 16:9
- Color
Keywords
- #Content-Based Slides
- #Design-Based Slides
- #Business Introduction
- #Market and Competitor Analysis
- #Diagram
- #Graph
- #Business Areas
- #Market Analysis
- #Cluster
- #Horizontal Bar
- #Closed Cluster Diagram
- #Segmented Horizontal Bar
- #16:9
- #horizontal bar chart PowerPoint
- #bar graph presentation slide
- #business analysis chart
- #market data visualization
- #comparison chart template
- #how to create bar chart in PowerPoint
About the Product
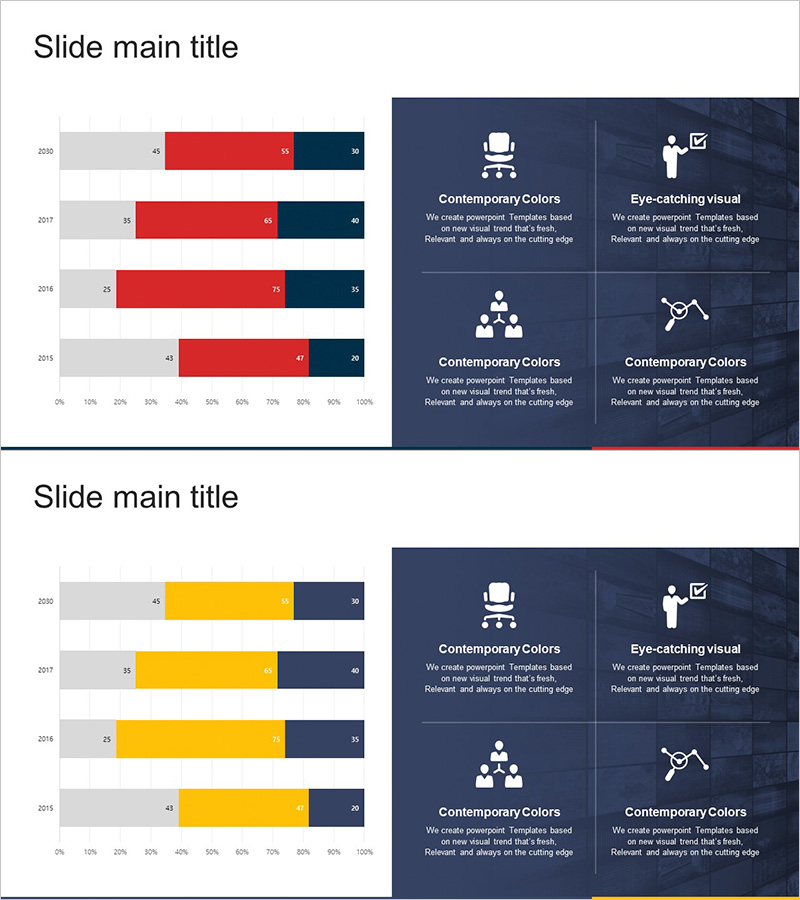
A horizontal bar chart PowerPoint slide designed for business solutions analysis and market data visualization. This presentation template displays year-over-year data from 2015 to 2020 using three distinct colors: gray, red, and navy blue. The slide effectively compares numerical values and trends at a glance, making it ideal for market analysis reports, business performance presentations, and strategic planning meetings. The 2-slide set features a balanced layout with the chart on the left and icon-based explanations on the right, enabling quick comprehension of complex business metrics.
Usage Points
-
Main Usage
Effectively visualizes year-over-year and item-by-item numerical comparisons and trend analysis. Ideal for presenting quantitative data such as market size, revenue trends, customer satisfaction scores, and competitive benchmarking. Serves as a credible reference material for executive briefings, investor presentations, and strategic planning sessions.
-
How to Use
Input your actual data into the left chart area and add key insights to the right icon section. Maintain the color scheme (gray, red, navy) while modifying numerical values, or customize year labels and item names to fit your specific business context and presentation needs.
-
Recommended For
Finance and planning teams for executive reports, marketing teams for market analysis presentations, sales teams for performance updates, quarterly and annual performance briefings to management, investor pitch decks, and consulting firms preparing client proposals.
-
Slide Structure
2-slide set with balanced left-right layout. Each slide features a horizontal bar chart on the left displaying 4 years of data (2015, 2016, 2017, 2020) and a 2×2 grid of icons with descriptive text on the right. First slide emphasizes red accent color; second slide features yellow accent for visual variety.
Related Products
-

Space Industry Segmentation Bar Graph – Essential for Market Analysis
#Market and Competitor Analysis #Diagram #Graph
-

Split Bar Graph and Pill Shape Diagram – Highlighting Marketing Strategy
#Market and Competitor Analysis #Marketing Plan and Strategy #Diagram
-

Crop Analysis Detailed Bar Graph – Insights into Market and Competition
#Market and Competitor Analysis #Diagram #Graph
-

Performance Analysis Breakdown Bar Graph – Market and Competitor Analysis
#Company Introduction #Market and Competitor Analysis #Diagram
