Medical Business Profit Structure Analysis Pie Chart
RM0500006_12
- Last Update 02/21/2025
- File Size 0.7MB
- # of Slides 2
- File Format PPTX
- Slide Ratio 16:9
- Color
Keywords
- #Content-Based Slides
- #Design-Based Slides
- #Product/Service Introduction
- #Business Introduction
- #Diagram
- #Graph
- #Development Status
- #Revenue Model
- #Cluster
- #Circles
- #Closed Cluster Diagram
- #Pie Chart
- #16:9
- #pie chart PowerPoint slide
- #medical business profit structure
- #4-segment revenue chart
- #PowerPoint graph template
- #business revenue visualization
About the Product
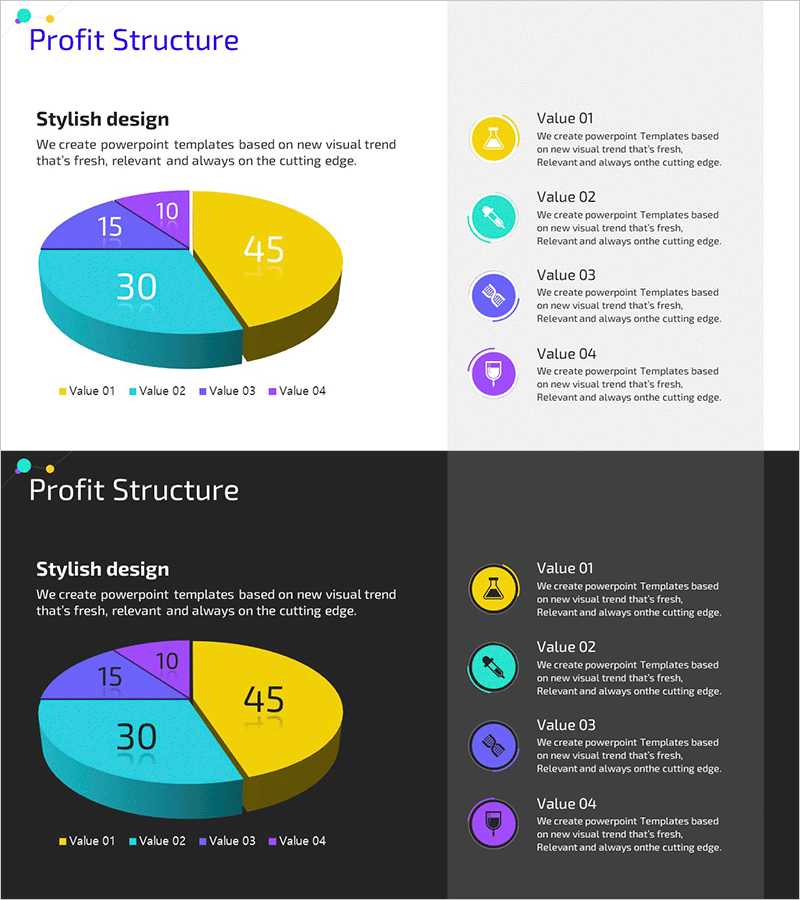
A 4-segment pie chart PowerPoint slide designed to visualize the profit structure of medical businesses. The chart features four color-coded sections—yellow, cyan, purple, and olive—representing different revenue streams with proportional sizing (45%, 30%, 10%, 15%). A 3D perspective effect enhances visual impact, while the right-side legend with circular icons provides clear labeling for each segment. Ideal for healthcare institutions, hospitals, and medical consulting firms presenting financial analysis, revenue breakdown, and business performance reports.
Usage Points
-
Main Usage
Visualize medical business revenue streams across four categories, showing the percentage contribution of each segment to total profit. Commonly used in financial presentations, business performance reports, investor pitches, and strategic planning sessions to demonstrate revenue diversification and departmental profitability.
-
How to Use
Replace the default segment values (15, 10, 30, 45) and labels (Value 01–04) with actual revenue categories such as clinical services, diagnostic testing, pharmaceutical sales, and ancillary services. Update the icons and descriptive text on the right to match your specific business segments and metrics.
-
Recommended For
Healthcare executives, medical consultants, hospital finance teams, medical startup founders, and healthcare industry analysts. Suitable for business performance reviews, investor presentations, revenue structure analysis, and healthcare market research presentations.
-
Slide Structure
2-slide set. Slide 1: Light gray background with 3D pie chart (4 segments: yellow 45%, cyan 30%, purple 10%, olive 15%) on the left, and right-side legend with 4 value items and corresponding icons. Slide 2: Dark charcoal background with identical pie chart and legend layout for versatile presentation environments.
Related Products
-

Revenue Model and Cost Analysis Circle Graph
#Product/Service Introduction #Business Introduction #Diagram
-

Investment Profit Structure Donut Chart
#Product/Service Introduction #Business Introduction #Diagram
-

Corporate Profit Structure Analysis Donut Chart
#Product/Service Introduction #Business Introduction #Diagram
-

Current Status Analysis Pie Chart – Insights for Market Analysis
#Product/Service Introduction #Market and Competitor Analysis #Diagram
