Watch Shape Market Share Graph – Data Visualization and Analysis
RJ0300059_17
- Last Update 05/04/2025
- File Size 1MB
- # of Slides 2
- File Format PPTX
- Slide Ratio 16:9
- Color
Keywords
- #Content-Based Slides
- #Design-Based Slides
- #Product/Service Introduction
- #Market and Competitor Analysis
- #Diagram
- #Graph
- #Development Status
- #Market Analysis
- #Cluster
- #Circles
- #Closed Cluster Diagram
- #Pie Chart
- #16:9
- #watch shape pie chart
- #pie chart PowerPoint slide
- #market share graph
- #data visualization PowerPoint
- #ratio presentation slide
- #circular chart template
About the Product
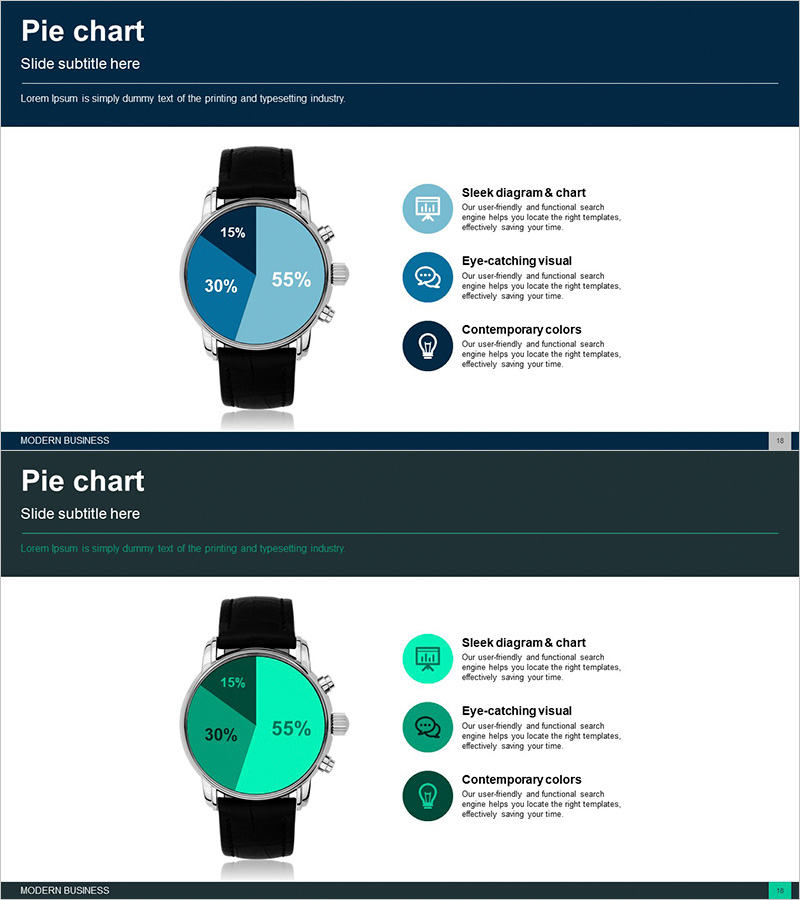
A distinctive pie chart PowerPoint slide designed in a watch shape for unique data visualization. Perfect for presenting market share, sales ratios, customer distribution, and other three-way comparisons. The dark blue background with light blue circular chart creates strong visual contrast, while right-aligned icons and text descriptions ensure clear information delivery. This 2-slide set offers multiple color variations (blue and turquoise) for immediate use in corporate presentations, marketing analysis reports, and product introduction materials. Available in 16:9 widescreen PPTX format, fully editable in all PowerPoint versions.
Usage Points
-
Main Usage
Optimized for visualizing proportions and percentages such as market share, sales ratios, customer distribution, and budget allocation. The distinctive watch design captures audience attention while maintaining data readability and professional appearance.
-
How to Use
Use in corporate performance presentations, marketing analysis reports, product introduction materials, and business plan market analysis sections. Edit text and numerical values in each segment to customize the chart with your own data.
-
Recommended For
Recommended for executives, marketing managers, sales teams, consultants, and analysts who rely on data-driven decision making. Particularly effective for executive briefings and client presentations where visual impact is critical.
-
Slide Structure
2-slide set. Each slide features a dark blue header area, center watch-shaped pie chart with 3 segments, and right-aligned icon, title, and description text area. First slide uses light blue tones; second slide features turquoise tones for color variation options.
Related Products
-

Current Status Analysis Pie Chart – Insights for Market Analysis
#Product/Service Introduction #Market and Competitor Analysis #Diagram
-

Market Analysis Pie Chart – Vibrant Visualization in Contemporary Colors
#Product/Service Introduction #Market and Competitor Analysis #Diagram
-

Pie Chart of Shooting Status Analysis – Visual Insights
#Product/Service Introduction #Market and Competitor Analysis #Diagram
-

Medical Business Profit Structure Analysis Pie Chart
#Product/Service Introduction #Business Introduction #Diagram
