Profit Structure Pie Chart – Revenue Model Analysis
RM0500005_12
- Last Update 02/21/2025
- File Size 0.3MB
- # of Slides 2
- File Format PPTX
- Slide Ratio 16:9
- Color
Keywords
About the Product
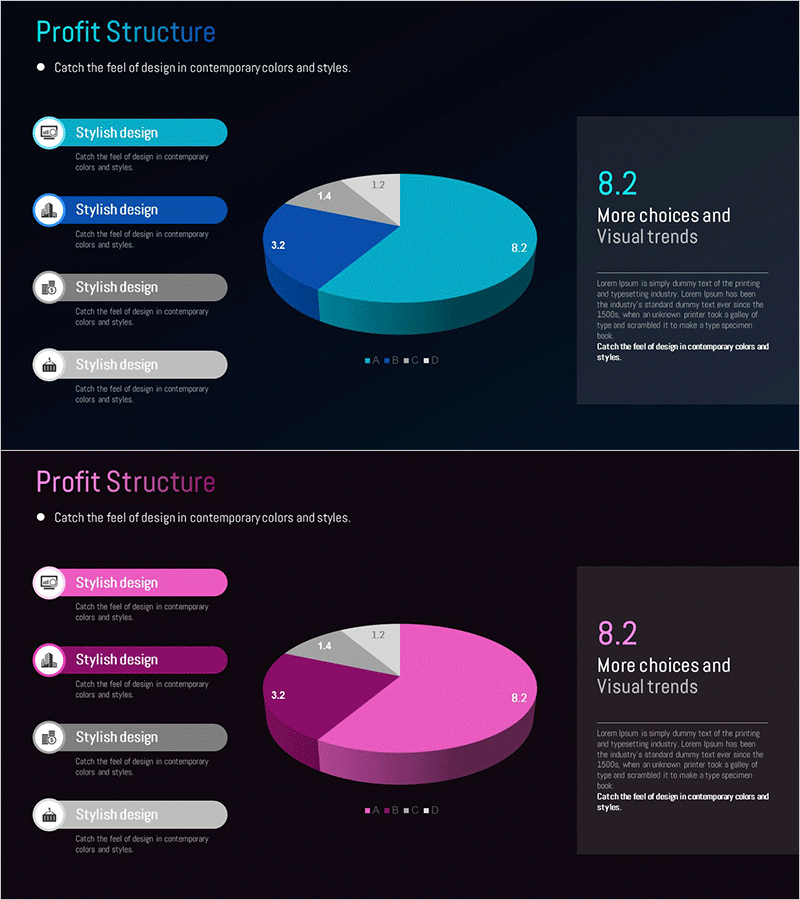
A 4-segment pie chart PowerPoint slide designed to visualize revenue models and profit structures. Features a 3D pie chart in cyan, blue, and gray tones that clearly represents the proportion of each revenue stream. The 2-slide set presents the same data from different perspectives, with a left-aligned icon list layout for adding item descriptions. Instantly applicable for business presentations, financial analysis, and business plan documents where revenue composition needs clear explanation.
Usage Points
-
Main Usage
Visualize company revenue sources, profit distribution structure, and business segment revenue proportions using a pie chart to enable stakeholders to grasp financial status at a glance. Ideal for investor presentations, executive reports, and business plan documents to clearly communicate revenue models.
-
How to Use
Enter revenue item names in the left-aligned icon list area and input corresponding percentage values in each pie chart segment. The 3D chart automatically calculates proportions, so updating data instantly reflects changes. Arrange the 2-slide set sequentially to present multiple interpretations of the same data.
-
Recommended For
CFOs, finance managers, and business development teams explaining revenue structures. Effective for startup business plans, quarterly earnings reports, investment pitch decks, and corporate presentations requiring clear revenue composition visualization.
-
Slide Structure
Slide 1: Cyan-dominant 4-segment pie chart with left-aligned 4-item list / Slide 2: Blue-dominant identical pie chart structure with right-aligned description area. Each segment accepts numeric input with automatic legend and data label synchronization.
Related Products
-

Revenue Model and Cost Analysis Circle Graph
#Product/Service Introduction #Business Introduction #Diagram
-

Medical Business Profit Structure Analysis Pie Chart
#Product/Service Introduction #Business Introduction #Diagram
-

Modern Theme Pie Chart – Market Share Analysis
#Product/Service Introduction #Market and Competitor Analysis #Graph
-

Development Status Pie Chart – Visualizing Market Share
#Product/Service Introduction #Market and Competitor Analysis #Graph
