Car Model Revenue Comparison Analysis Graph – Insights into Market Trends
RM0500003_14
- Last Update 02/20/2025
- File Size 1.2MB
- # of Slides 2
- File Format PPTX
- Slide Ratio 16:9
- Color
Keywords
- #Content-Based Slides
- #Design-Based Slides
- #Business Introduction
- #Market and Competitor Analysis
- #Diagram
- #Graph
- #Technological Status
- #Competitive Advantage
- #Cluster
- #Line
- #Closed Cluster Diagram
- #Line Chart
- #16:9
- #line chart PowerPoint slide
- #revenue analysis presentation template
- #automotive market trend graph
- #sales performance chart
- #data visualization slides
About the Product
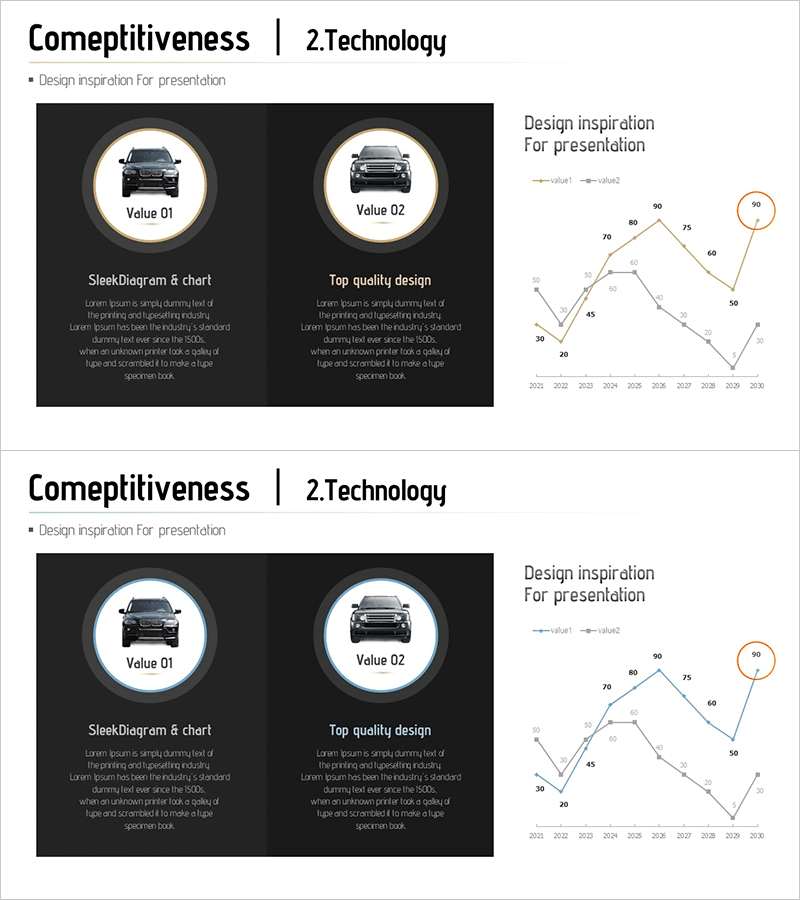
A line chart PowerPoint slide that visualizes revenue trends across car models in the automotive industry. Featuring a dark background with orange and gray data series, this presentation slide uses circular accent markers to highlight key data points. Ideal for market trend analysis, competitive benchmarking, and sales performance presentations. The 2-slide set enables visualization of multiple revenue scenarios, optimized for 16:9 widescreen format on modern displays. Ready-to-use template for executive reports and quarterly business reviews.
Usage Points
-
Main Usage
Designed to represent revenue changes, sales performance trends, and market share fluctuations across car models over time. Serves as a quantitative foundation for executive reports, quarterly earnings presentations, and competitive benchmarking analyses in the automotive sector.
-
How to Use
Input two data series for revenue comparison; the line chart automatically renders with data points marked by circular indicators. Modify legend labels and axis titles to adapt the template for different industries, product categories, or time periods. Supports quick data updates without redesigning the slide structure.
-
Recommended For
Recommended for automotive marketing, sales, and business planning teams preparing quarterly or annual performance reports. Effective for investor presentations, executive board meetings, and market analysis documents requiring quantitative credibility and professional visualization.
-
Slide Structure
2-slide set with dark background (black), two-series line chart in orange and gray, approximately 8–10 data points per series, circular accent marker, legend, and labeled X-axis (years) and Y-axis (revenue). Delivered in 16:9 widescreen format.
Related Products
-

Analysis of Reading Volume by Data – Market Status and Competitive Advantage
#Market and Competitor Analysis #Diagram #Graph
-

Mobile Service Technology Analysis Graph – Market and Competitor Analysis
#Market and Competitor Analysis #Diagram #Graph
-

Service Analysis Line Graph – Visualization of Competitive Advantage
#Market and Competitor Analysis #Diagram #Graph
-

Annual Investment Analysis Graph – Competitor Analysis and Cluster Visualization
#Market and Competitor Analysis #Diagram #Graph
