Mobile Service Technology Analysis Graph – Market and Competitor Analysis
RJ0400062_26
- Last Update 06/04/2025
- File Size 0.2MB
- # of Slides 2
- File Format PPTX
- Slide Ratio 16:9
- Color
Keywords
- #Content-Based Slides
- #Design-Based Slides
- #Market and Competitor Analysis
- #Diagram
- #Graph
- #Competitor Analysis
- #Competitive Advantage
- #Cluster
- #Line
- #Closed Cluster Diagram
- #Line Chart
- #16:9
- #line chart PowerPoint slide
- #multi-series trend analysis
- #market analysis template
- #data visualization PPT
- #how to create line graph in PowerPoint
About the Product
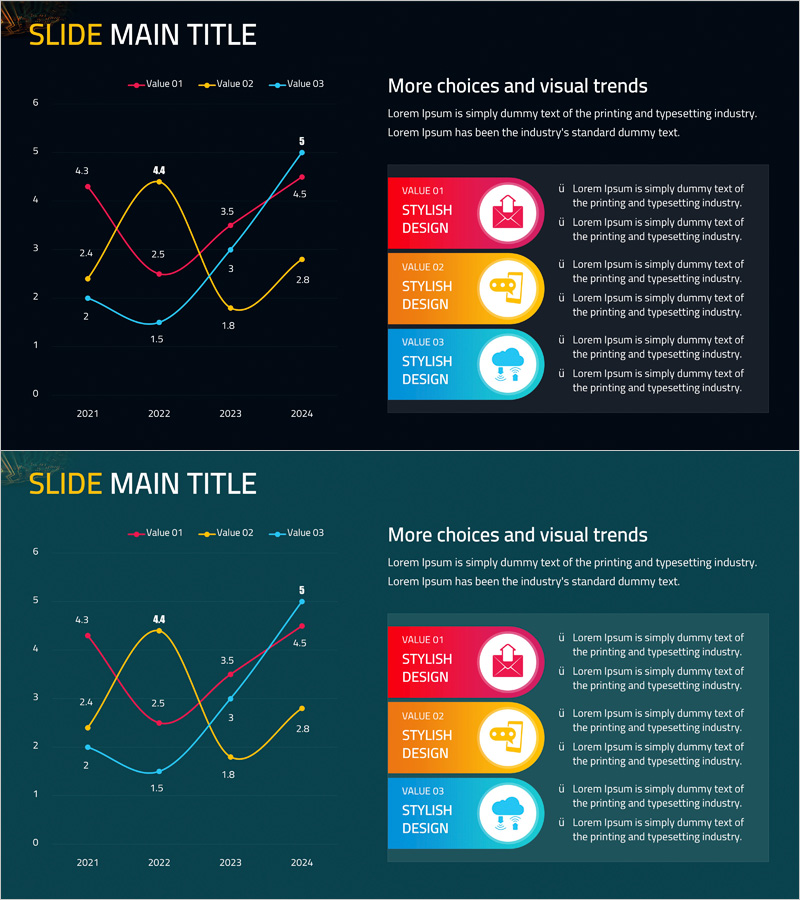
A multi-series line chart PowerPoint slide visualizing data trends from 2021 to 2024 across three distinct data series. Red, yellow, and blue lines represent different metrics, with data points clearly labeled with numerical values for precise comparison. The right side features VALUE 01, 02, and 03 description boxes for detailed insights. This presentation slide is ready to use for market analysis, competitor benchmarking, technology performance tracking, and strategic business reporting.
Usage Points
-
Main Usage
Display and compare three or more data series over time to identify trends, growth patterns, and competitive positioning. Ideal for presenting market performance, competitor analysis, and key performance indicators in a single visual.
-
How to Use
Input your actual data into the left-side line chart and add corresponding analysis text in the VALUE boxes on the right. Adjust the year axis (2021–2024) and value scale (0–6) to match your dataset. Customize colors and labels as needed for your presentation context.
-
Recommended For
Marketing and strategy teams presenting market analysis, sales teams comparing competitor metrics, technical teams reporting performance trends, and executives reviewing business performance and growth trajectories.
-
Slide Structure
2-slide set. Each slide features a 3-series line chart on the left (red, yellow, blue lines with data point labels) and three VALUE description boxes on the right. Includes legend and gridlines. 16:9 widescreen format, PPTX file.
Related Products
-

Annual Investment Analysis Graph – Competitor Analysis and Cluster Visualization
#Market and Competitor Analysis #Diagram #Graph
-

Service Analysis Line Graph – Visualization of Competitive Advantage
#Market and Competitor Analysis #Diagram #Graph
-

Social Network Market Competitor Analysis PPT – Data Driven Competitive Advantage
#Market and Competitor Analysis #Diagram #Graph
-

Competitor Revenue Analysis Graph
#Market and Competitor Analysis #Graph #Competitor Analysis
