Annual Investment Analysis Graph – Competitor Analysis and Cluster Visualization
RJ0300095_22
- Last Update 05/16/2025
- File Size 1.1MB
- # of Slides 2
- File Format PPTX
- Slide Ratio 16:9
- Color
Keywords
- #Content-Based Slides
- #Design-Based Slides
- #Market and Competitor Analysis
- #Diagram
- #Graph
- #Competitor Analysis
- #Competitive Advantage
- #Cluster
- #Line
- #Closed Cluster Diagram
- #Line Chart
- #16:9
- #line chart PowerPoint slide
- #multi-series trend analysis
- #annual comparison chart
- #business investment graph
- #3-series line chart template
- #how to create line chart in PowerPoint
About the Product
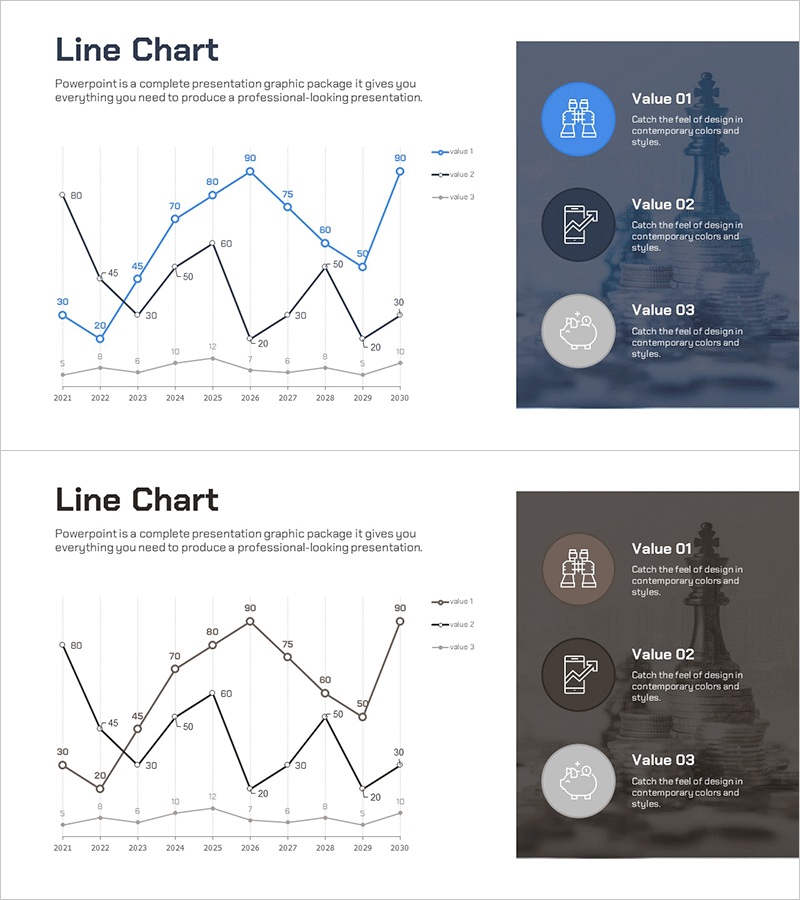
A multi-series line chart PowerPoint slide designed for annual business investment analysis and trend visualization. This presentation template displays 10-year data from 2021 to 2030 across three distinct series in blue, black, and gray tones, making it ideal for competitor analysis and performance benchmarking. The right panel features three icon areas (Value 01, 02, 03) for highlighting key insights and metrics. The slide deck is ready to use in executive reports, strategic presentations, and business analysis documents. Provided in 16:9 widescreen PPTX format with 2 slides.
Usage Points
-
Main Usage
Visualize long-term business investment trends across multiple data series using line charts to analyze competitive positioning and market dynamics. The right-side icon panel emphasizes key performance indicators and strengthens presentation impact for executive audiences.
-
How to Use
Insert this slide into executive reports, business plans, and investor pitch decks where year-over-year performance comparison is needed. Customize line colors and data values to represent company performance versus competitors or market benchmarks. Adapt for departmental or product-line performance tracking.
-
Recommended For
Finance managers, strategic planners, sales directors, and marketing professionals presenting quarterly or annual performance metrics to executives. Particularly effective for competitive analysis, market share trends, and ROI performance discussions.
-
Slide Structure
Left side features a line chart with X-axis spanning 2021–2030 and Y-axis ranging 0–90, displaying three data series with 10 data points each (values 20–90 range). Right side contains a dark background panel with three circular icon areas (Value 01, 02, 03) arranged vertically for text input.
Related Products
-

Service Analysis Line Graph – Visualization of Competitive Advantage
#Market and Competitor Analysis #Diagram #Graph
-

Social Network Market Competitor Analysis PPT – Data Driven Competitive Advantage
#Market and Competitor Analysis #Diagram #Graph
-

Mobile Service Technology Analysis Graph – Market and Competitor Analysis
#Market and Competitor Analysis #Diagram #Graph
-

Competitor Analysis Broken Line Graph – Exploring Competitive Advantage in the Market
#Market and Competitor Analysis #Graph #Competitor Analysis
