Business Area Progress Analysis Circle Graph – Simple and Stylish
RM0500002_5
- Last Update 02/20/2025
- File Size 1.2MB
- # of Slides 2
- File Format PPTX
- Slide Ratio 16:9
- Color
Keywords
- #Content-Based Slides
- #Design-Based Slides
- #Product/Service Introduction
- #Business Introduction
- #Diagram
- #Graph
- #Development Status
- #Business Areas
- #Cluster
- #Circles
- #Closed Cluster Diagram
- #Doughnut Chart
- #16:9
- #donut chart PowerPoint slide
- #3-section pie chart template
- #business area analysis presentation
- #circular chart diagram
- #proportion visualization slide
About the Product
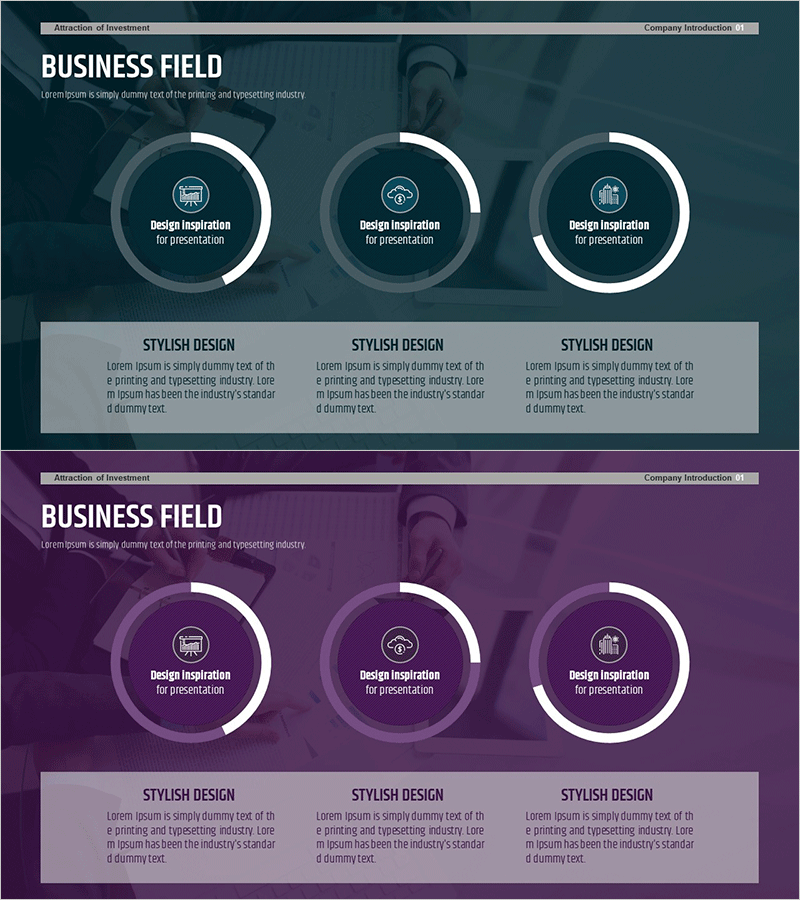
A PowerPoint slide featuring a 3-section donut chart for visualizing business area progress and performance metrics. The design uses a dark teal background with white-bordered circular chart segments, allowing clear representation of data proportions. Each section includes dedicated text areas below the chart for detailed descriptions, with integrated icons and explanatory text ready for immediate presentation use. The 2-slide set offers color variations (teal and purple) that can be customized to match your corporate branding.
Usage Points
-
Main Usage
Designed to compare and analyze business area progress rates, proportions, and composition visually. The donut chart format utilizes the center space for key metrics or titles, while the 3-section structure clearly communicates the proportion of major business lines.
-
How to Use
Enter business area names (e.g., Solutions, Services, Products) and progress percentages in each section's text area. Icons can be replaced with images representing each area's characteristics, and background colors can be adjusted to match your corporate palette. Use both slides to compare progress across different time periods.
-
Recommended For
Ideal for executive reports, business performance presentations, strategy meetings, and investor pitch decks. Effective for marketing, strategy, and sales teams explaining business portfolio composition, market share, and customer segment analysis.
-
Slide Structure
2-slide set. Each slide contains a title area at the top, a 3-section donut chart with white borders in the center, and three section-specific icon and text boxes at the bottom. Slide 1 features a dark teal background; Slide 2 uses a purple background for color variation.
Related Products
-

Construction Business Analysis Donut Chart
#Product/Service Introduction #Business Introduction #Diagram
-

Donut Diagram Visualizing Technology Development Status
#Company Introduction #Product/Service Introduction #Diagram
-

Pie Chart of Shooting Status Analysis – Visual Insights
#Product/Service Introduction #Market and Competitor Analysis #Diagram
-

Exercise Objectives Achieved Diagram & Chart – Post-Progress
#Product/Service Introduction #Business Introduction #Diagram
