Construction Business Analysis Donut Chart
RM0500004_5
- Last Update 02/21/2025
- File Size 1.4MB
- # of Slides 2
- File Format PPTX
- Slide Ratio 16:9
- Color
Keywords
- #Content-Based Slides
- #Design-Based Slides
- #Product/Service Introduction
- #Business Introduction
- #Diagram
- #Graph
- #Development Status
- #Business Areas
- #Cluster
- #Circles
- #Closed Cluster Diagram
- #Doughnut Chart
- #16:9
- #donut chart PowerPoint slide
- #pie chart template download
- #ratio analysis PPT
- #business data visualization slide
- #construction analysis PowerPoint
About the Product
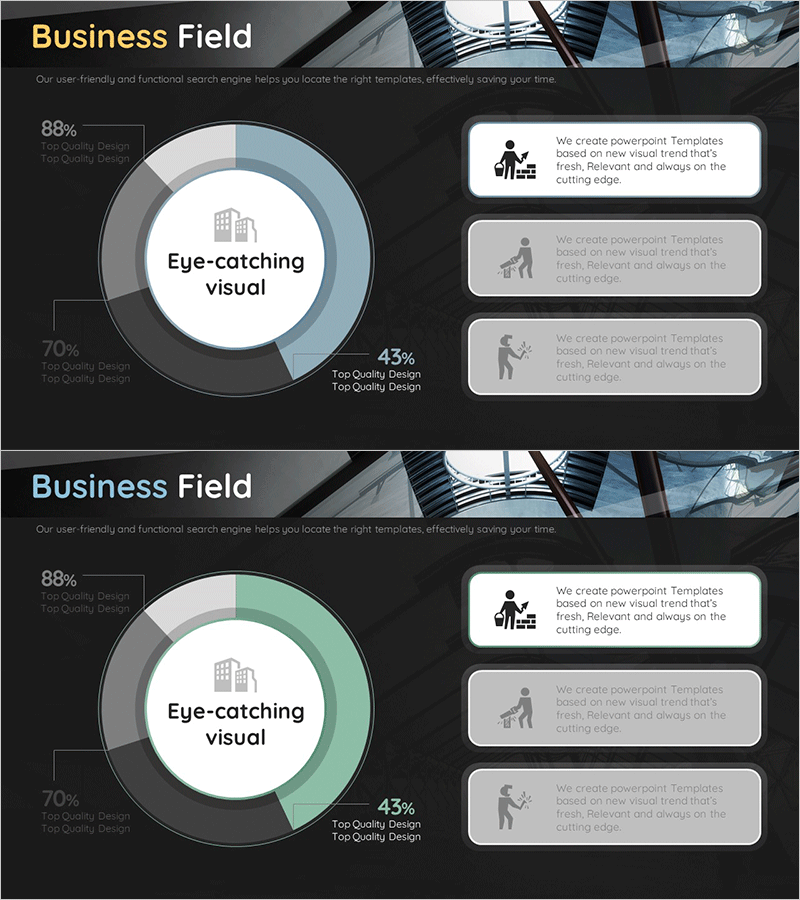
A professional donut chart PowerPoint slide optimized for construction and business analysis presentations. This 2-slide template features a dark background with blue, green, and gray segments that clearly distinguish data proportions. The center circular space allows for key metrics, titles, or summary figures, making it ideal for visualizing cost breakdowns, market share, business segment distribution, and other multi-category ratio data. Each segment displays percentage values and icons for intuitive data interpretation. Formatted in 16:9 widescreen for seamless compatibility with modern projectors and displays.
Usage Points
-
Main Usage
Visualize 3-4 category proportions such as cost composition, market share, or business segment distribution in construction and business analysis reports. The center circular space emphasizes key figures or titles, enhancing visual impact and audience comprehension.
-
How to Use
Double-click each segment to edit colors, percentages, and labels with your actual data. Replace icons to match category meanings, and customize the center circle with company name, analysis title, or key performance indicators. All elements are fully editable in PowerPoint.
-
Recommended For
Ideal for construction companies, real estate developers, and business analysts presenting financial reports, investor presentations, and executive briefings. Recommended for roles requiring quantitative data visualization: executives, planners, and analysts presenting portfolio composition, customer demographics, or financial breakdowns.
-
Slide Structure
2-slide template: Slide 1 features a 3-segment donut chart (blue, green, gray segments with percentage labels) and center circle for title/metrics, with 3 explanation text boxes on the right / Slide 2 offers a green-tone color variant. All elements are customizable and grouped for easy editing.
Related Products
-

Business Area Progress Analysis Circle Graph – Simple and Stylish
#Product/Service Introduction #Business Introduction #Diagram
-

Pie Chart of Shooting Status Analysis – Visual Insights
#Product/Service Introduction #Market and Competitor Analysis #Diagram
-

Business Area Analysis Donut Chart – Clear Visualization
#Product/Service Introduction #Business Introduction #Graph
-

Exercise Objectives Achieved Diagram & Chart – Post-Progress
#Product/Service Introduction #Business Introduction #Diagram
