Key Financial Indicators and Growth Outlook – Optimized Graphs for Investment Proposals
RM0500009_7
- Last Update 02/22/2025
- File Size 0.5MB
- # of Slides 2
- File Format PPTX
- Slide Ratio 16:9
- Color
Keywords
- #Content-Based Slides
- #Design-Based Slides
- #Business Introduction
- #Market and Competitor Analysis
- #Diagram
- #Graph
- #Market Analysis
- #Table
- #Horizontal Bar
- #Standard Table
- #Horizontal Bar Chart
- #16:9
- #horizontal bar chart PowerPoint
- #financial metrics slide template
- #growth outlook graph
- #investment pitch presentation
- #data comparison chart PowerPoint
About the Product
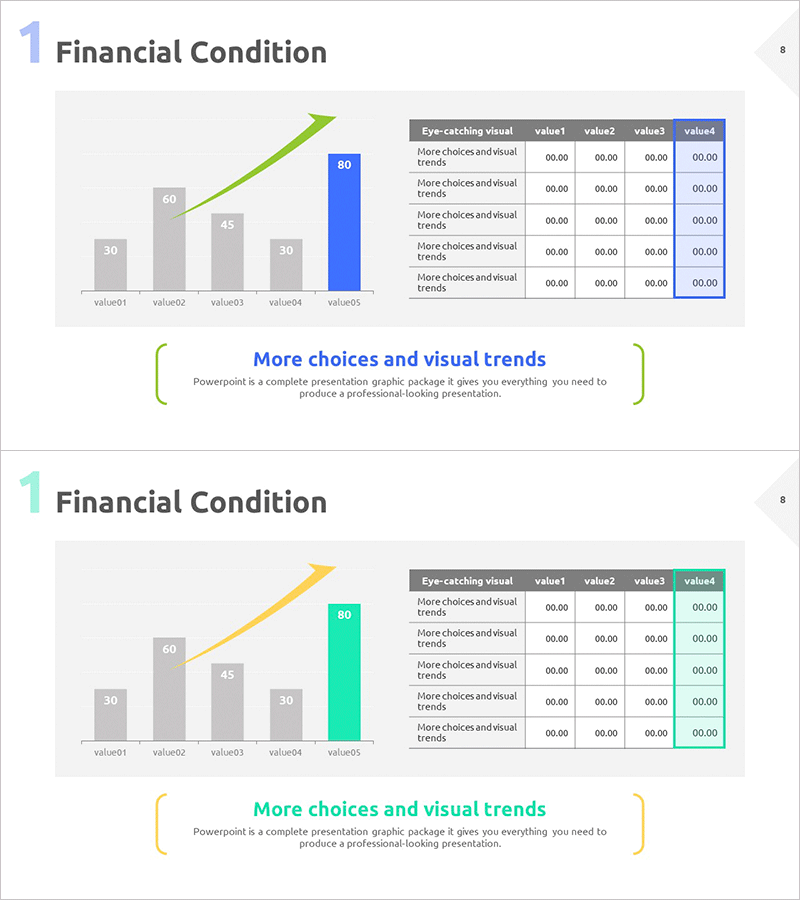
A financial metrics PowerPoint slide optimized for investment pitch presentations. This slide deck compares five key financial indicators using horizontal bars, while a green trend line displays growth outlook simultaneously. The blue accent bar and ascending trend line visually highlight critical metrics, with a data table on the right providing precise figures. Ideal for immediate use in financial analysis, market performance, and ROI comparisons across 2 slides.
Usage Points
-
Main Usage
This slide is designed to convince investors of your company's financial health and growth potential through data-driven visualization in investment presentations. The horizontal bar chart intuitively compares five financial metrics (revenue, profit, growth rate, etc.), while the trend line clearly demonstrates future growth direction.
-
How to Use
Enter the five metric values on slide 1, and the horizontal bars automatically adjust. On slide 2, modify the trend line data to represent growth projections. Update the data table on the right with precise figures to enhance credibility. Customize colors to match your corporate brand identity.
-
Recommended For
CFOs, finance managers, and investor relations professionals presenting financial status and growth strategy to executives and investors. Particularly effective for startup fundraising pitches, corporate earnings presentations, and financial sections of business plans.
-
Slide Structure
Slide 1: 5-item horizontal bar chart (range 30–80) with blue accent bar and right-aligned data table (5 rows × 4 columns). Slide 2: Identical layout with green ascending trend line showing growth outlook. 16:9 widescreen format, PPTX file, 2-slide set.
Related Products
-

Financial Status and Revenue Structure Analysis Chart – Business Insights
#Business Introduction #Market and Competitor Analysis #Diagram
-

Business Status and Market Analysis Doughnut Slide – Harmony of Blue and Orange
#Business Introduction #Market and Competitor Analysis #Diagram
-

Cell Phone Mockup Bar Graph – Market Analysis and Technology Status
#Business Introduction #Market and Competitor Analysis #Graph
-

Blue Green Horizontal Bar Graph – Optimized for Market and Competitive Analysis
#Market and Competitor Analysis #Diagram #Graph
