Sales and Profit Table – Clear Visualization of Financial Planning
RJ0300024_12
- Last Update 04/24/2025
- File Size 0.2MB
- # of Slides 2
- File Format PPTX
- Slide Ratio 16:9
- Color
Keywords
- #Content-Based Slides
- #Design-Based Slides
- #Financial Plans and Performance
- #Diagram
- #Other
- #Income Statement
- #Sales and Revenue
- #Table
- #Standard Table
- #Mockup
- #16:9
- #financial table PowerPoint
- #sales profit slide template
- #income statement template
- #financial analysis chart
- #table chart PPT download
About the Product
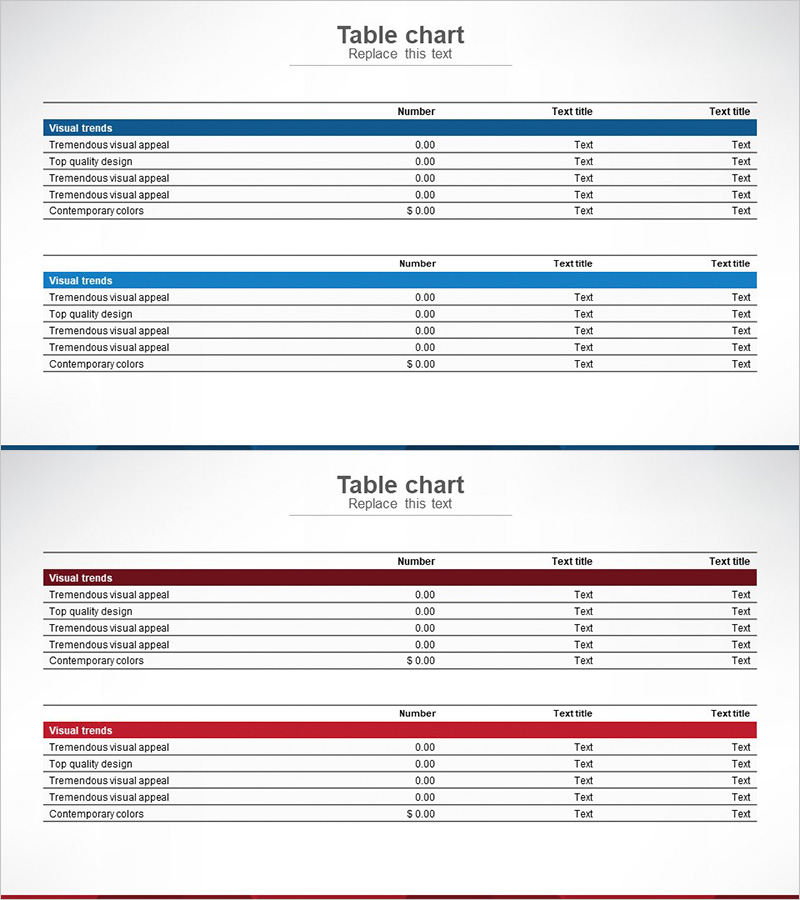
A table-based PowerPoint slide designed for financial planning and performance analysis. This presentation template clearly organizes sales and profit data in a row-and-column structure, making it ideal for income statements, financial reports, and business performance presentations. The 2-slide set enables side-by-side comparison of multiple financial metrics (figures, ratios, and growth rates) with a dark header and light body layout that establishes clear information hierarchy. Delivered in 16:9 widescreen PPTX format for seamless compatibility across all presentation environments.
Usage Points
-
Main Usage
Organize financial data (revenue, profit, expenses, profit margin) in tabular format for income statements, financial performance reports, quarterly and annual financial analysis presentations. Serves as objective financial communication tool for executives, investors, and stakeholders to understand company financial status.
-
How to Use
Input actual sales and profit figures directly into table cells for immediate use. Edit header row categories (quarters, years, departments) and left-column items (revenue, cost of goods sold, net profit) to adapt the template for various financial analysis scenarios. Use color highlighting to emphasize key performance indicators.
-
Recommended For
CFOs, financial managers, executives, investor relations specialists, and accounting teams presenting quarterly earnings, annual financial reports, investment pitch decks, and business plan financial sections. Suitable for startup pitching, corporate earnings presentations, and financial consulting materials.
-
Slide Structure
2-slide set with each slide featuring a 5-row × 3-column table structure (or similar configuration). First slide uses dark header (dark red or navy) with white text; second slide offers color variation for visual diversity. Each cell accommodates numerical input with flexible formatting for currency symbols, percentages, and decimal places.
Related Products
-

Orange Green Profit and Loss Chart – Visualizing Revenue and Profit
#Financial Plans and Performance #Diagram #Graph
-

Profit Analysis Graph – Visualizing Financial Performance
#Financial Plans and Performance #Diagram #Income Statement
-

Bank Income Statement – Visualizing Financial Performance
#Financial Plans and Performance #Diagram #Income Statement
-

Business Income Statement Slide – Table for Financial Clarity
#Financial Plans and Performance #Diagram #Income Statement
