Income Statement Table – Clear Visualization of Financial Performance
RJ0400058_11
- Last Update 06/02/2025
- File Size 0.1MB
- # of Slides 2
- File Format PPTX
- Slide Ratio 16:9
- Color
Keywords
- #Content-Based Slides
- #Design-Based Slides
- #Financial Plans and Performance
- #Diagram
- #Income Statement
- #Sales and Revenue
- #Table
- #Standard Table
- #16:9
- #income statement table
- #financial table PowerPoint
- #income statement slide template
- #financial data visualization
- #quarterly earnings presentation
- #table slide design PowerPoint
About the Product
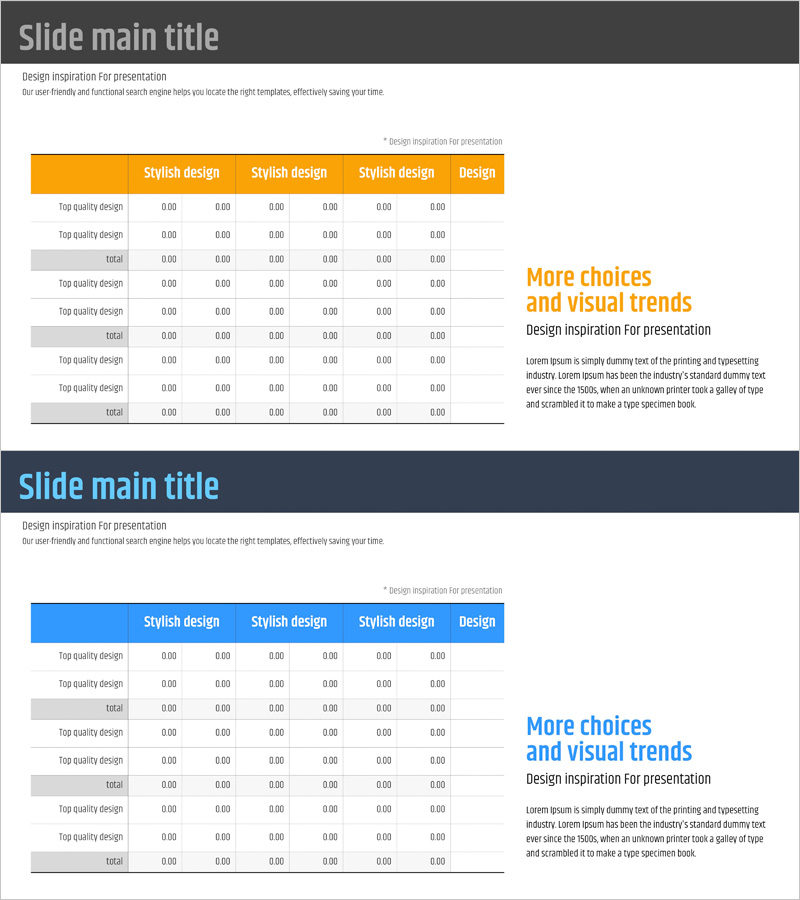
A professional income statement table PowerPoint slide that clearly visualizes financial performance and results. This slide deck features two design versions with orange and blue headers, presenting 6-column financial data in organized rows for easy comparison. Display revenue, expenses, and profit metrics at a glance with a structured layout perfect for quarterly or annual performance presentations. Provided in 16:9 widescreen PPTX format with fully editable cells, headers, and color schemes for seamless customization.
Usage Points
-
Main Usage
Present financial performance and business results using structured numerical data. The income statement table organizes key metrics such as revenue, cost of goods sold, operating expenses, operating income, and net income in a clear, comparable format for quarterly or annual analysis.
-
How to Use
Use this slide in investor presentations, executive briefings, and financial analysis meetings. Customize the table rows and columns with your own financial data, highlight key figures, and adjust colors to emphasize important metrics and capture audience attention.
-
Recommended For
CFOs, financial managers, executives, and investor relations professionals presenting financial results. Ideal for quarterly earnings reports, annual business reviews, investor pitch decks, and strategic planning sessions where financial transparency is essential.
-
Slide Structure
2-slide set. Each slide contains a table with 6 columns (item name, Q1, Q2, Q3, Q4, total) and 8-9 rows (revenue, cost, operating expenses, operating income, etc.). Headers are highlighted in orange or blue, while data cells use white backgrounds with black text for optimal readability and professional appearance.
Related Products
-

Transportation Business Sales and Profit Table – Financial Analysis
#Financial Plans and Performance #Diagram #Income Statement
-

Sales and Profit Calculation Table – Efficient Profit Management
#Financial Plans and Performance #Diagram #Income Statement
-

Sales and Profit Analysis Chart – An Effective Tool for Financial Performance
#Financial Plans and Performance #Diagram #Income Statement
-

Financial Plans and Performance Presentation Template – Professional and Elegant Design
#Financial Plans and Performance #Diagram #Income Statement
