Sales and Profit Table – Financial Performance Visualization
RJ0400053_19
- Last Update 06/01/2025
- File Size 0.1MB
- # of Slides 2
- File Format PPTX
- Slide Ratio 16:9
- Color
Keywords
About the Product
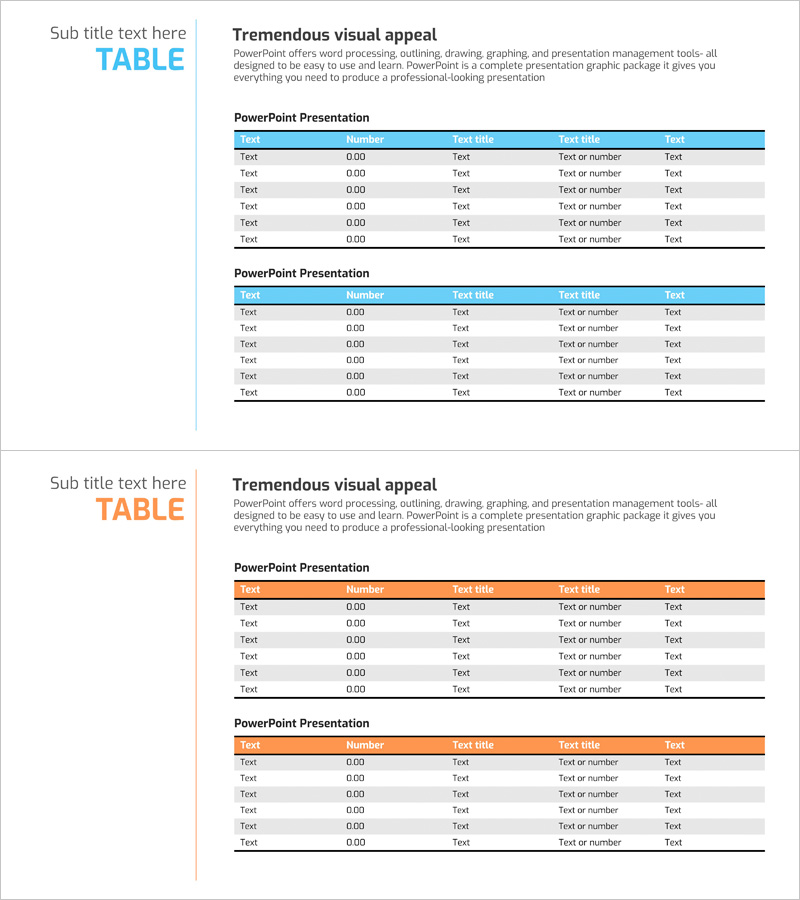
A financial data table PowerPoint slide designed to clearly visualize sales and profit performance. Featuring two distinct color schemes with blue and orange headers, each table provides six rows for data entry. The layout is optimized for organizing numbers, text, and financial metrics in a structured format, making it ideal for investor presentations, financial reports, and business plans. Available in 16:9 widescreen PPTX format, fully editable in all PowerPoint versions.
Usage Points
-
Main Usage
Present financial performance data in table format to investors, employees, and partners with clarity and credibility. The slide enables side-by-side comparison of key financial indicators such as revenue, profit margin, and expenses, supporting quarterly financial reports, investor relations materials, and business plan reviews.
-
How to Use
Enter category names in the table headers (blue or orange) and input corresponding numerical values in the rows below. The first table suits primary metrics like revenue, profit, and costs; the second table works well for quarterly or year-over-year comparisons. Colors and fonts can be freely customized to match your corporate branding.
-
Recommended For
CFOs, financial managers, executives, and investor relations professionals presenting financial results. Ideal for quarterly earnings presentations, annual financial reports, investor pitch decks, business plan financial sections, and shareholder meeting materials.
-
Slide Structure
Two-slide layout with independent table designs. First slide features a blue-header table (5 columns × 6 rows); second slide offers an orange-header table (5 columns × 6 rows), supporting diverse financial data combinations and comparisons.
Related Products
-

Transportation Business Sales and Profit Table – Financial Analysis
#Financial Plans and Performance #Diagram #Income Statement
-

Affiliate Business Income Statement – Visualizing Financial Performance
#Financial Plans and Performance #Diagram #Income Statement
-

Sales and Profit Table Diagram
#Financial Plans and Performance #Diagram #Income Statement
-

Illustration Theme Income Statement Table – A Fresh Perspective on Financial Data
#Financial Plans and Performance #Diagram #Income Statement
