Internet Shopping Sales and Profit Calculation Chart – Your Business Success Guide
RJ0400046_20
- Last Update 05/29/2025
- File Size 0.2MB
- # of Slides 2
- File Format PPTX
- Slide Ratio 16:9
- Color
Keywords
- #Content-Based Slides
- #Design-Based Slides
- #Financial Plans and Performance
- #Diagram
- #Graph
- #Income Statement
- #Sales and Revenue
- #Table
- #Column
- #Grouped Column
- #16:9
- #grouped bar chart PowerPoint
- #sales profit comparison chart
- #PowerPoint graph slide template
- #business data visualization
- #4-item bar chart slide
About the Product
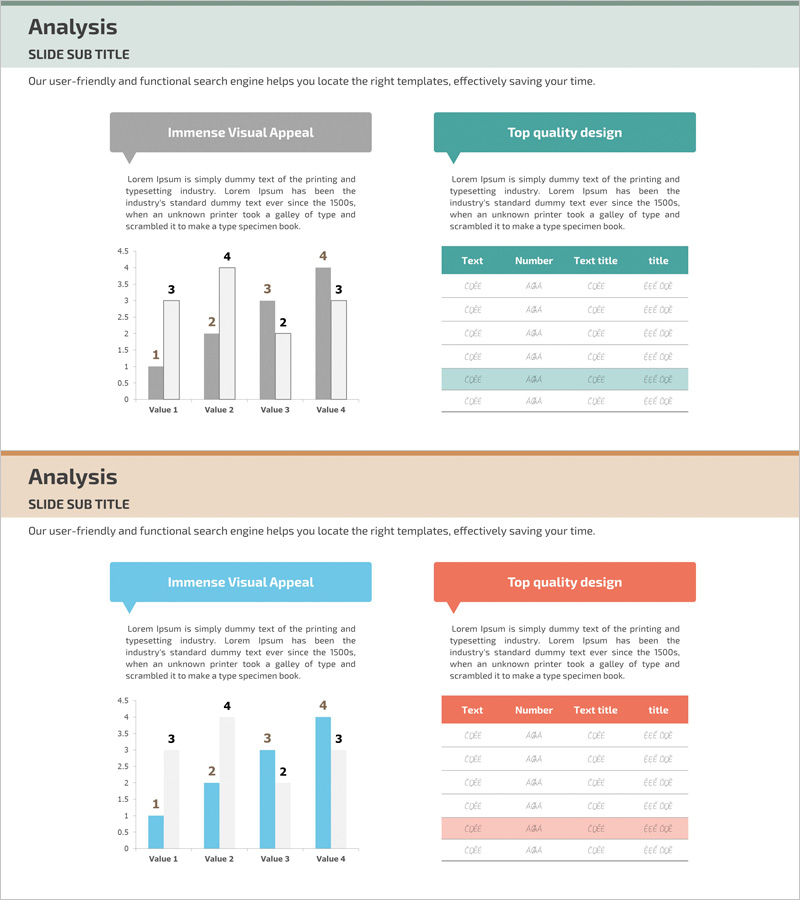
A grouped bar chart PowerPoint slide designed to compare internet shopping sales and profit data at a glance. This presentation template features two data series (gray and teal) across four items, with clear numerical values displayed for each category. Perfect for business performance analysis, financial reports, and sales presentations where comparative data visualization is essential. The 16:9 widescreen format includes 2 slides that are fully editable, allowing you to customize colors, values, and labels to match your specific business needs.
Usage Points
-
Main Usage
Visualize sales and profit data using a grouped bar chart format to enable clear item-by-item numerical comparison and performance differentiation. Optimized for e-commerce, retail, and sales-driven businesses requiring financial performance analysis and revenue trend presentation.
-
How to Use
Ideal for financial reports, quarterly performance presentations, business plan pitches, and investor briefings where sales trends and profitability metrics need to be communicated clearly. The grouped bar structure allows audiences to instantly compare values across categories and understand performance gaps.
-
Recommended For
CFOs, financial analysts, business managers, marketing directors, and executive presenters responsible for sales performance, profitability analysis, and business growth reporting. Suitable for organizations of all sizes, from startups to enterprises, requiring professional data visualization.
-
Slide Structure
Two-slide set featuring grouped bar charts on contrasting backgrounds (gray and teal). Each slide displays four data items with two data series represented by adjacent bars in complementary colors. Numerical values are clearly labeled above each bar, enabling precise data comparison and trend analysis across all categories.
Related Products
-

Orange Green Profit and Loss Chart – Visualizing Revenue and Profit
#Financial Plans and Performance #Diagram #Graph
-

Business Sales and Profit Statement Slide – Realizing Financial Plans
#Financial Plans and Performance #Diagram #Income Statement
-

Business Sales and Income Analysis Table – Effective Visualization of Financial Performance
#Financial Plans and Performance #Diagram #Income Statement
-

Business Income Statement – Visualizing Financial Performance
#Financial Plans and Performance #Diagram #Income Statement
