Eco-friendly Survey Graph – Environmental Protection and Data Utilization
RJ0600105_18
- Last Update 07/19/2025
- File Size 7.1MB
- # of Slides 2
- File Format PPTX
- Slide Ratio 16:9
- Color
Keywords
- #Content-Based Slides
- #Design-Based Slides
- #Business Strategy
- #Market and Competitor Analysis
- #Graph
- #Other
- #Achievements
- #Market Analysis
- #16:9
- #market analysis graph PowerPoint
- #data visualization slides
- #comparative chart PPT
- #bar and line graph slide
- #how to create market analysis charts in PowerPoint
About the Product
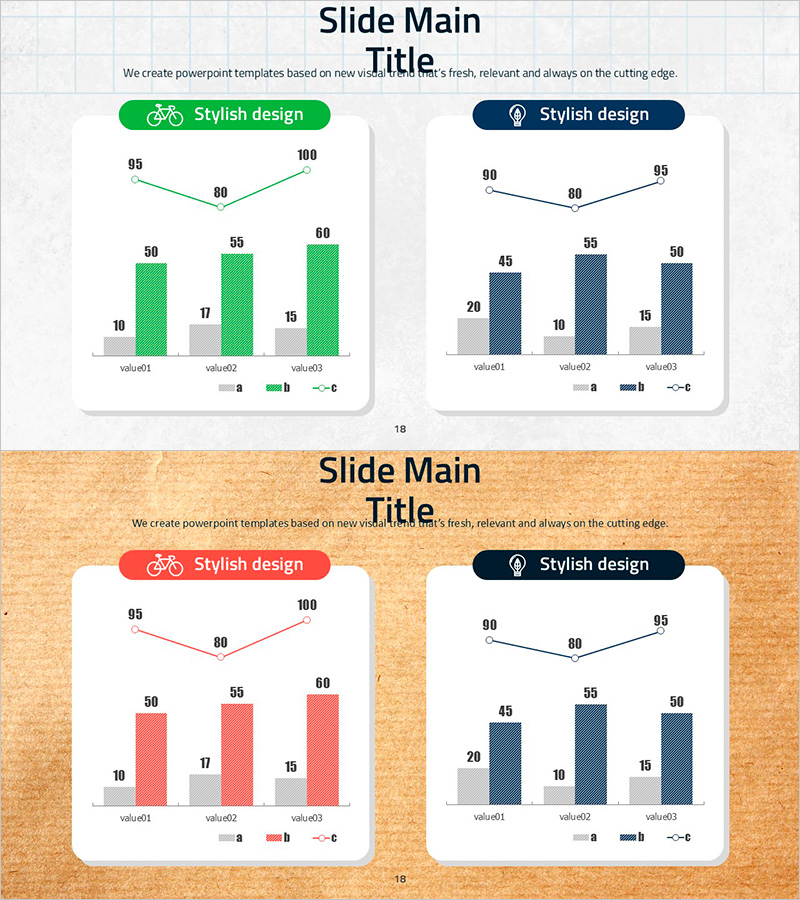
A PowerPoint slide optimized for market analysis and data visualization with dual-color comparative charts. The design features green and navy bar graphs paired with line charts, enabling clear comparative analysis across three data points (value01, value02, value03). Each slide displays trend data via the upper line chart while emphasizing detailed metrics through lower bar graphs. Formatted in 16:9 widescreen PPTX for seamless compatibility with modern presentation environments. Ideal for presenting market conditions, competitive analysis, customer survey results, and quantitative data in persuasive business presentations.
Usage Points
-
Main Usage
Presents quantitative market data, competitive benchmarking, and customer survey findings through comparative analysis. The dual-color contrast clearly distinguishes separate data sets, while the combination of trend lines and value bars enables multi-layered information delivery.
-
How to Use
Replace value01–value03 text and numbers with your own data. Select either the green or navy color scheme to align with corporate branding, then update both the line chart and bar graph values simultaneously to maintain consistent data representation.
-
Recommended For
Recommended for marketing plans, business reports, investor presentations, market analysis briefings, and quarterly performance reviews. Ideal for marketing managers, business analysts, strategists, and executives who need data-driven decision support.
-
Slide Structure
Two-slide set featuring 'Stylish design' labels with color badges at the top, bar graphs displaying three data points in the center, and trend line charts above. Clear legends and axis labels ensure intuitive data interpretation and professional presentation impact.
Related Products
-

Management Performance Analysis Mixed Chart – Visualizing Strategies and Achievements
#Business Strategy #Market and Competitor Analysis #Graph
-

Management Performance Analysis Mixed Chart – Data Insights and Strategic Analysis
#Business Strategy #Market and Competitor Analysis #Graph
-

Graph of Major Projects and Success Stories - Business Achievement
#Business Strategy #Market and Competitor Analysis #Graph
-

Selected Area Graphs – Market and Performance Analysis
#Business Strategy #Market and Competitor Analysis #Graph
