Selected Area Graphs – Market and Performance Analysis
RJ0600103_28
- Last Update 07/19/2025
- File Size 0.4MB
- # of Slides 2
- File Format PPTX
- Slide Ratio 16:9
- Color
Keywords
About the Product
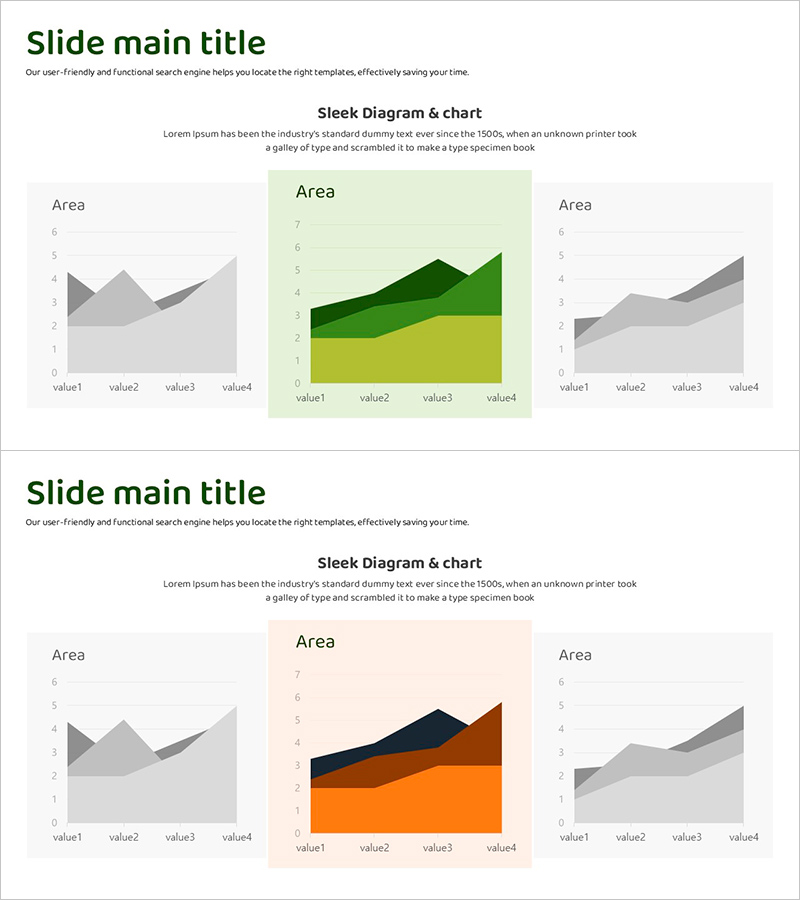
A 2-slide area graph PowerPoint presentation for market and performance analysis. Features a central multi-layered chart in green, yellow, and gray tones alongside single-color area graphs on the left and right for effective data comparison. Delivered in 16:9 widescreen PPTX format, fully editable and ready to use. Ideal for visualizing competitive analysis, business performance, market share, and multi-dimensional datasets. Each slide includes title and description text areas plus four data input points for flexible customization.
Usage Points
-
Main Usage
Visualize and compare multi-layered datasets with clarity. The central 3-color stacked area chart displays compositional changes over time, while the flanking single-color graphs emphasize individual metric trends. Perfect for market share analysis, competitive benchmarking, quarterly performance reviews, and business segment comparisons.
-
How to Use
Enter your analysis topic in the title area (e.g., Market Overview, Competitive Analysis, Performance Comparison). Input actual data values into the four data points (value1–value4) on each graph. The central chart's three layers represent category composition, while side graphs show overall trends. Colors can remain as designed or be adjusted to match your corporate brand.
-
Recommended For
Executive reports, business plans, investor presentations, and marketing strategy pitches. Particularly suited for market analysis sections, competitor comparisons, quarterly performance reviews, and business unit revenue breakdowns. Recommended for finance, strategy, and marketing teams presenting data-driven insights to stakeholders.
-
Slide Structure
2-slide deck with consistent layout: title and description text areas at the top (2 lines), chart area below. Central chart is a 4-point stacked area graph in three colors; left and right charts are single-color area graphs with matching data points. All text and values are in editable text boxes for seamless customization.
Related Products
-

Analysis Graph of Key Performance and Corporate Growth Indicators – Emphasizing Business Achievements
#Business Strategy #Market and Competitor Analysis #Graph
-

Eco-friendly Survey Graph – Environmental Protection and Data Utilization
#Business Strategy #Market and Competitor Analysis #Graph
-

Management Performance Analysis Mixed Chart – Visualizing Strategies and Achievements
#Business Strategy #Market and Competitor Analysis #Graph
-

Graph of Major Projects and Success Stories - Business Achievement
#Business Strategy #Market and Competitor Analysis #Graph
