Construction Company Debt and Capital Structure Analysis Chart
RM0500004_7
- Last Update 02/21/2025
- File Size 1.5MB
- # of Slides 2
- File Format PPTX
- Slide Ratio 16:9
- Color
Keywords
- #Content-Based Slides
- #Design-Based Slides
- #Business Introduction
- #Market and Competitor Analysis
- #Diagram
- #Graph
- #Other
- #Future Outlook
- #Table
- #Standard Table
- #16:9
- #financial table chart PowerPoint
- #debt capital structure analysis slide
- #financial comparison presentation
- #construction company financial chart
- #numerical data visualization PPT
About the Product
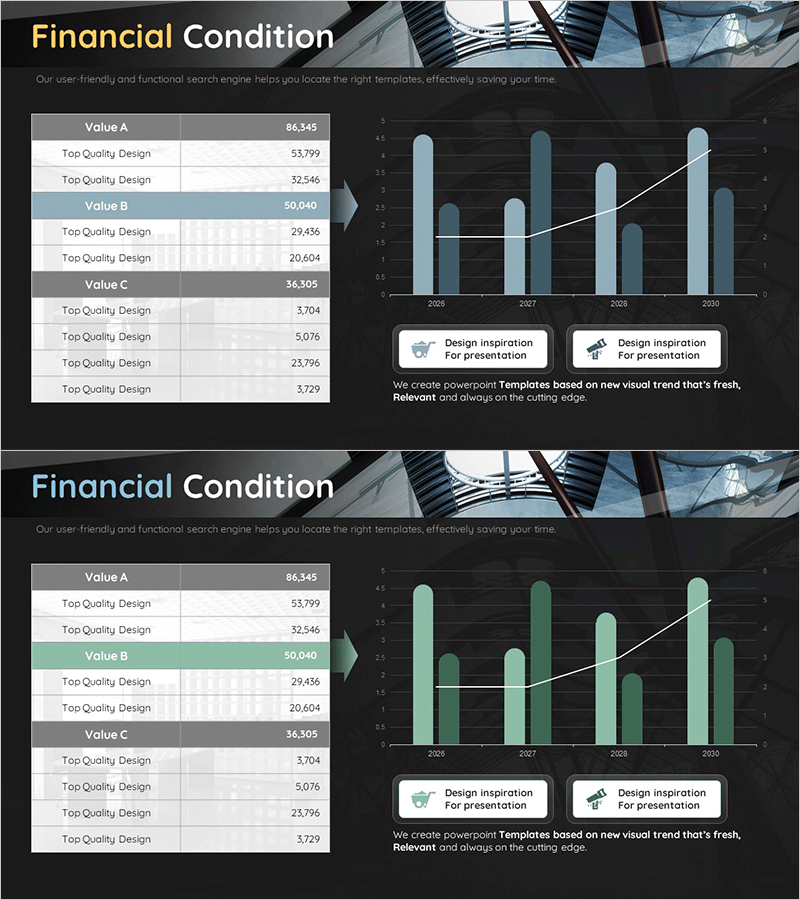
A financial analysis PowerPoint slide designed to present construction company debt and capital composition clearly. The slide features a three-row table structure (Value A, B, C) with multiple columns displaying detailed financial metrics, enabling side-by-side comparison of capital structure. A dark background with light blue accent colors enhances readability of numerical data, while a hybrid chart on the right (bar + line graph) simultaneously conveys trend changes from 2006 to 2030. Two-slide set includes color variations (blue and green) for flexible presentation scenarios. This ready-to-use slide deck is ideal for financial analysis presentations in construction, real estate, and banking sectors.
Usage Points
-
Main Usage
Quantitatively compare and analyze corporate debt and capital composition while visually demonstrating financial soundness. The table format presents precise figures while the accompanying chart shows trend changes, building investor and stakeholder confidence in financial stability.
-
How to Use
Use in financial analysis, investor relations presentations, and business report sections when explaining capital structure and debt ratios. Replace table values with actual company data and adjust chart legends to match presentation context for immediate deployment. Dark background ensures clarity in projector environments.
-
Recommended For
CFOs, financial officers, investment pitch presenters, business report managers, and financial analysts in construction, real estate, finance, and manufacturing sectors. Particularly effective for shareholder meetings, investor relations presentations, and bank loan application materials requiring financial soundness documentation.
-
Slide Structure
Slide 1: Dark background with 3-row (Value A, B, C) × 4-column table displaying item names and three financial metrics, plus right-side hybrid chart with four bars and one trend line (2006–2030). Slide 2: Identical structure with light green accent color. Both slides include two 'Design Inspiration' banners at bottom.
Related Products
-

Financial Status Analysis Chart – Business Introduction and Future Insights
#Business Introduction #Market and Competitor Analysis #Diagram
-

Revenue Growth Analysis Graph & Table - Financial Condition and Data Visualization
#Business Introduction #Diagram #Graph
-

Brown Mixed Graph – Business Introduction and Market Analysis
#Business Introduction #Market and Competitor Analysis #Graph
-

Food Truck Sales Rise Graph - Strong Business Strategy
#Business Strategy #Market and Competitor Analysis #Diagram
