Food Truck Sales Rise Graph - Strong Business Strategy
RJ0800013_22
- Last Update 08/03/2025
- File Size 0.4MB
- # of Slides 2
- File Format PPTX
- Slide Ratio 16:9
- Color
Keywords
- #Content-Based Slides
- #Design-Based Slides
- #Business Strategy
- #Market and Competitor Analysis
- #Diagram
- #Graph
- #Other
- #Financial Outlook & Expected Impact
- #Future Outlook
- #Table
- #Standard Table
- #16:9
- #area chart PowerPoint slide
- #sales trend visualization
- #business growth graph
- #data visualization template
- #how to create area chart in PowerPoint
About the Product
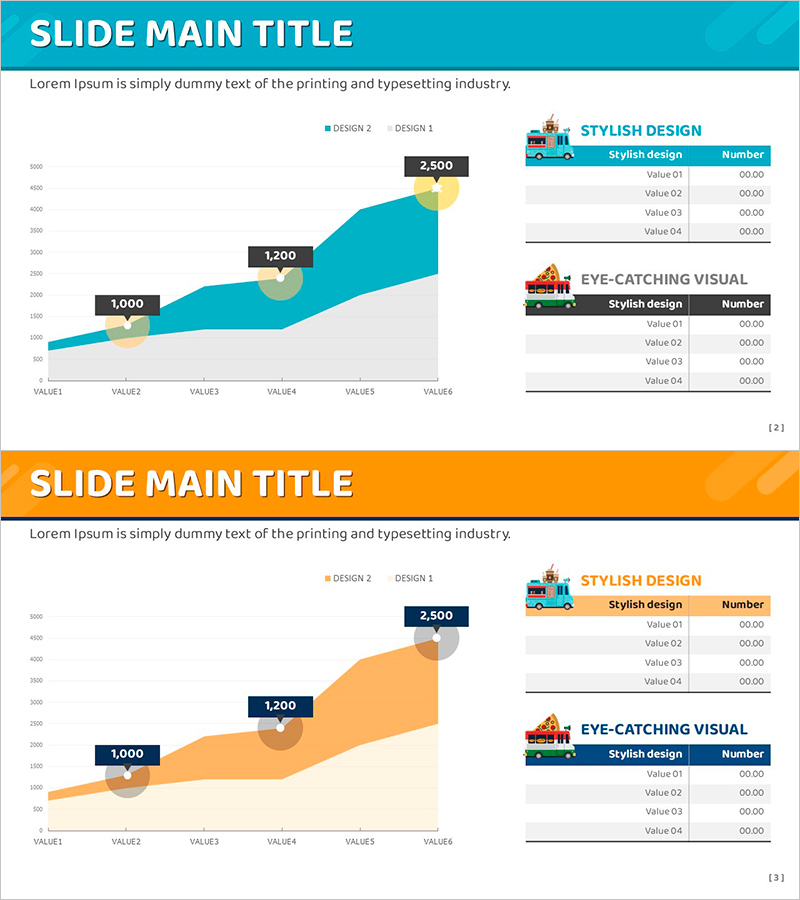
A turquoise gradient area chart PowerPoint slide visualizing food truck sales growth trajectory. Data point labels (1,000·1,200·2,500) clearly mark growth milestones across six value stages. The right side features two information sections—Stylish Design and Eye-Catching Visual—with accompanying icons and editable tables for additional metrics. Two-slide set includes color variation (turquoise and orange), formatted in 16:9 widescreen for modern presentation environments and business reporting.
Usage Points
-
Main Usage
Visualize revenue changes, growth trends, and cumulative data over time using an area chart format. Effectively communicate business performance for food truck operations, small businesses, and franchise models with intuitive graphical representation.
-
How to Use
Insert into business plans, quarterly performance reports, investor pitch decks, and marketing analysis presentations. Replace data point values with actual revenue figures and populate the right-side tables with relevant metrics and descriptions to create customized presentation materials.
-
Recommended For
Startup founders, small business owners, franchise operators, marketing managers, and financial analysts presenting sales growth, business expansion, and market share increases. Ideal for investor pitches, employee briefings, and client proposal presentations.
-
Slide Structure
Left side features a turquoise gradient area chart with six data points (VALUE1–VALUE6) connected by a continuous area fill. Three labels (1,000·1,200·2,500) highlight key milestones. Right side contains two icon-labeled sections (Stylish Design and Eye-Catching Visual), each with a four-row editable table for supplementary information and metrics.
Related Products
-

Growth Curve Area Graph - Market and Competitive Analysis
#Business Strategy #Market and Competitor Analysis #Graph
-

Construction Company Debt and Capital Structure Analysis Chart
#Business Introduction #Market and Competitor Analysis #Diagram
-

Analysis and Graphs in Future Prediction – Market Strategy and Profitability
#Business Strategy #Market and Competitor Analysis #Diagram
-

Business Strategy Analysis with Line Chart
#Business Strategy #Market and Competitor Analysis #Diagram
