Industry Growth Rate and Trend Analysis Chart – Market Prospect
RM0500002_10
- Last Update 02/20/2025
- File Size 1.1MB
- # of Slides 2
- File Format PPTX
- Slide Ratio 16:9
- Color
Keywords
- #Content-Based Slides
- #Design-Based Slides
- #Market and Competitor Analysis
- #Graph
- #Other
- #Market Status
- #Future Outlook
- #Circles
- #Pie Chart
- #16:9
- #pie chart PowerPoint slide
- #market share analysis template
- #growth rate visualization
- #4-segment pie chart
- #business data presentation slide
- #how to create pie chart in PowerPoint
About the Product
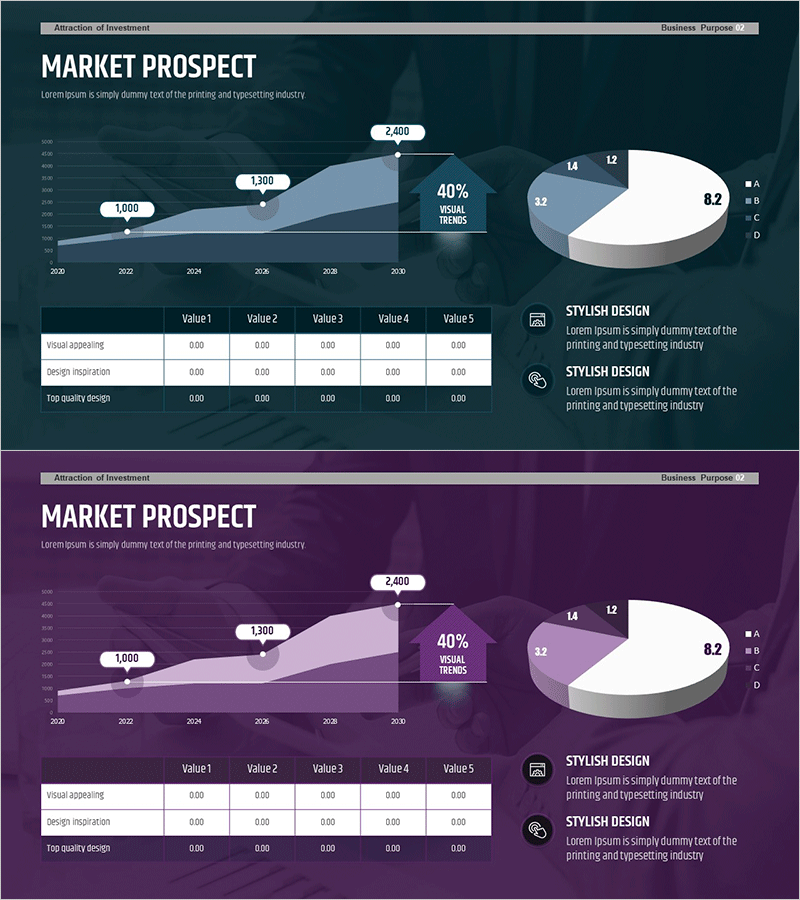
A professional PowerPoint slide template combining pie chart and area graph to visualize industry growth rates and market prospects. The dark teal background with white pie chart segments and layered area visualization ensures clear data representation. The slide displays growth trends from 2020 to 2030 using an area chart with three data series, while a 4-segment pie chart shows market composition. A 40% emphasis text box highlights key insights, and a data table below provides detailed numerical values. This presentation slide is ready to use for business reports, investment pitches, competitive analysis, and strategic planning documents.
Usage Points
-
Main Usage
This slide effectively communicates market growth rates, competitor market share, and industry trends through dual visualization. The pie chart clarifies current market composition across four segments, while the area graph illustrates temporal changes in growth patterns. The 40% emphasis box draws attention to critical metrics, enhancing audience engagement and comprehension.
-
How to Use
Insert this slide into the market analysis section of business plans, market opportunity pages in investor pitch decks, or performance analysis portions of quarterly business reports. Replace the four pie chart segment labels and percentages with your actual data. Update the table values in columns Value1 through Value5 with your specific metrics. Modify the area graph years and growth values to reflect your actual performance data.
-
Recommended For
Marketing managers, business strategists, financial analysts, and executives presenting market conditions and competitive positioning. Particularly valuable for new business proposals, investor presentations, and strategic planning meetings where data-driven decision-making is essential.
-
Slide Structure
Slide 1: Title area (Attraction of Investment / Business Purpose) + area graph (2020–2030 growth trends with three data series) + 4-segment pie chart (segments A, B, C, D) + 40% emphasis box + legend. Slide 2: Identical layout in purple tone variant. Bottom section contains 3-row × 5-column data table (Visual appealing / Design inspiration / Top quality design rows) displaying detailed numerical values.
Related Products
-

Technology Outlook Graph - Market Status and Future Projections
#Market and Competitor Analysis #Graph #Other
-

Industry Trends and Market Growth Analysis Chart
#Market and Competitor Analysis #Diagram #Graph
-

Two Comparison Line Graphs – Market Status and Future Outlook
#Market and Competitor Analysis #Graph #Market Status
-

Curved Hill Shape Graph – Market Trend and Growth Analysis
#Market and Competitor Analysis #Graph #Other
