Competitor Comparison Analysis Table – Visualizing Market Analysis
RM0500010_13
- Last Update 02/22/2025
- File Size 0.4MB
- # of Slides 2
- File Format PPTX
- Slide Ratio 16:9
- Color
Keywords
- #Content-Based Slides
- #Design-Based Slides
- #Market and Competitor Analysis
- #Diagram
- #Graph
- #Competitor Analysis
- #Market Analysis
- #Cluster
- #Table
- #Closed Cluster Diagram
- #16:9
- #competitor comparison table PowerPoint
- #competitive analysis slide template
- #market analysis presentation
- #competitor analysis diagram
- #4-row comparison table PPT
About the Product
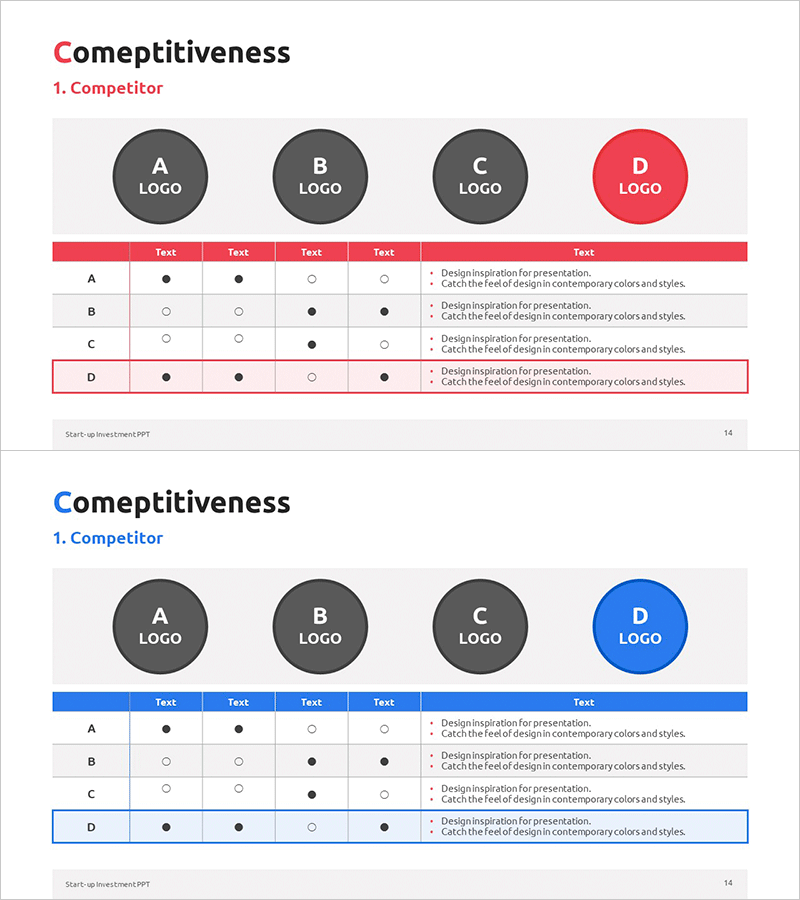
A structured comparison analysis table PowerPoint slide that displays four competitors and five evaluation criteria in a matrix format. The red and blue dual-tone header row and checkmark symbols (● and ○) enable viewers to instantly identify each competitor's strengths and weaknesses. The two-slide set provides identical layouts with color variations, making it ready for immediate use in presentations and reports. This slide template is optimized for market analysis, competitive strategy, and product positioning sections, transforming raw data into actionable business intelligence.
Usage Points
-
Main Usage
Structurally compare competitors across key evaluation dimensions—features, pricing, service, quality—to clearly communicate your company's market position. Serves as a critical data-driven slide for investor pitches, executive briefings, and strategic planning meetings.
-
How to Use
Enter competitor names (A, B, C, D) in each row and evaluation criteria (features, price, design, support, other) in each column. Use checkmarks (● for strength, ○ for weakness) to mark each competitor's capabilities. Add descriptive text below the table to highlight competitive advantages and differentiation points.
-
Recommended For
Business strategists, marketing planners, product managers, management consultants, and startup founders preparing competitive analysis materials. Ideal for business plans, investor pitch decks, marketing strategy documents, and product strategy reports.
-
Slide Structure
Two-slide set. Each slide features a 4-row (competitors A, B, C, D) × 5-column (evaluation criteria) table with logo area at top and descriptive text zone at bottom. First slide uses red header; second uses blue header for visual variety and flexible presentation flow.
Related Products
-

Note Illustration Theme Chart – Market Analysis and Competitor Insights Tool
#Market and Competitor Analysis #Diagram #Graph
-

Sales and Profit Analysis Graph – Market Trends and Forecast
#Market and Competitor Analysis #Diagram #Graph
-

Apparel Industry Market Analysis Graph – Visualizing Growth Statistics
#Market and Competitor Analysis #Diagram #Graph
-

Concise Analysis Column Graph & Table Slide
#Market and Competitor Analysis #Diagram #Graph
