Key Statistics Overview Slide – Market Analysis and Competitive Context
RB0800049_8
- Last Update 03/26/2025
- File Size 2.8MB
- # of Slides 2
- File Format PPTX
- Slide Ratio 4:3
- Color
Keywords
- #Content-Based Slides
- #Design-Based Slides
- #Market and Competitor Analysis
- #Diagram
- #Graph
- #Market Analysis
- #Market Overview
- #Table
- #Circles
- #Standard Table
- #Pie Chart
- #4:3
- #pie chart PowerPoint slide
- #circular graph presentation
- #market analysis slide template
- #competitor analysis PPT
- #data visualization PowerPoint
- #ratio chart slide download
About the Product
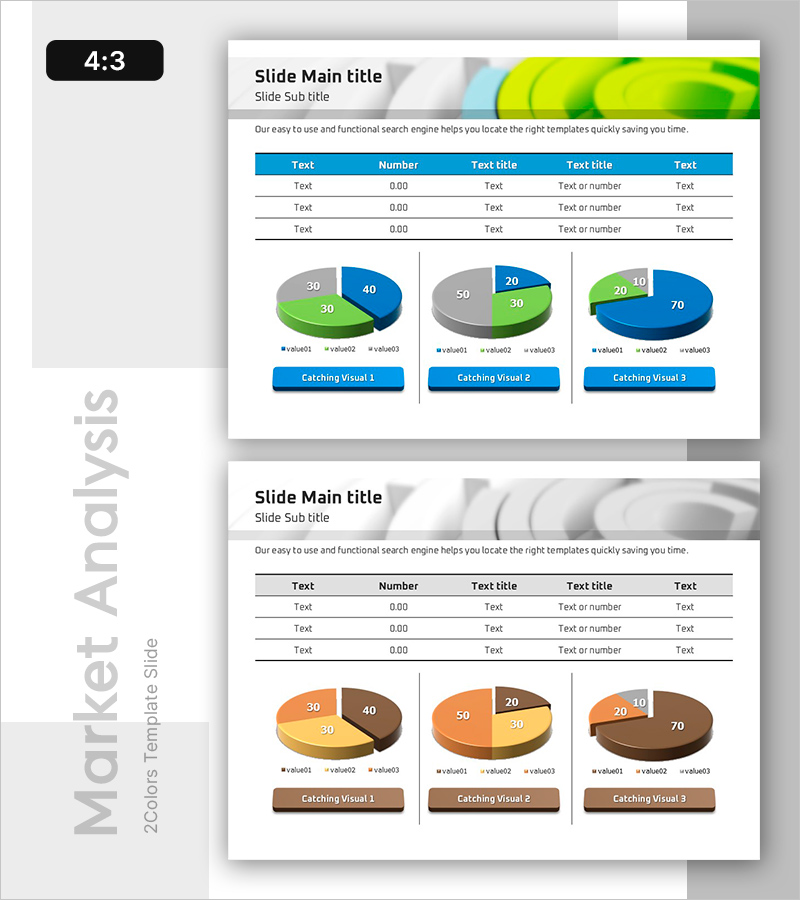
A comprehensive PowerPoint slide featuring three pie charts designed to visualize market analysis and competitive positioning. Each chart displays 3-4 data series using distinct colors including blue, green, gray, orange, and brown for clear differentiation. The slide includes an editable data table at the top and labeled button-style text boxes below each chart for topic emphasis. Fully customizable in PPTX format, enabling quick adaptation for business presentations, competitive analysis reports, and market overview decks.
Usage Points
-
Main Usage
Simultaneously display market share, competitor ratios, and customer distribution across three pie charts to strengthen comparative analysis. The linked table-to-chart functionality ensures data consistency and enables real-time updates across all visualizations.
-
How to Use
Deploy in business plans, marketing strategy documents, and quarterly performance reports within market analysis sections. Modify table values to automatically update all pie charts, and customize button labels with titles such as 'Market Share,' 'Competitor Analysis,' or 'Customer Distribution.'
-
Recommended For
Marketing professionals, strategic planners, sales managers, and executives presenting market conditions and competitive landscapes. Ideal for scenarios requiring multi-series data comparison on a single slide.
-
Slide Structure
2-slide deck: Title slide plus content slide with 5×5 data table, three pie charts with legends, and button-style text boxes. Each pie chart displays 3-4 color-coded data series optimized for 4:3 aspect ratio.
Related Products
-

Detailed Analysis in Book Illustration PowerPoint Template
#Market and Competitor Analysis #Diagram #Graph
-

Red Ratio Horizontal Bar Graph – Market Analysis and Trends
#Market and Competitor Analysis #Diagram #Graph
-

Graph Charts for Systematic Market Analysis – Bar and Pie Charts
#Technical Approach #Market and Competitor Analysis #Diagram
-

Performance Analysis with Donut Chart and Table
#Market and Competitor Analysis #Diagram #Graph
