Red Ratio Horizontal Bar Graph – Market Analysis and Trends
RJ0800037_24
- Last Update 08/10/2025
- File Size 0.1MB
- # of Slides 2
- File Format PPTX
- Slide Ratio 16:9
- Color
Keywords
- #Content-Based Slides
- #Design-Based Slides
- #Market and Competitor Analysis
- #Diagram
- #Graph
- #Market Analysis
- #Market Overview
- #Table
- #Horizontal Bar
- #Standard Table
- #Segmented Horizontal Bar
- #16:9
- #horizontal bar chart PowerPoint
- #bar graph slide template
- #market analysis chart
- #5-item comparison graph
- #competitive analysis PPT
- #data visualization slide
About the Product
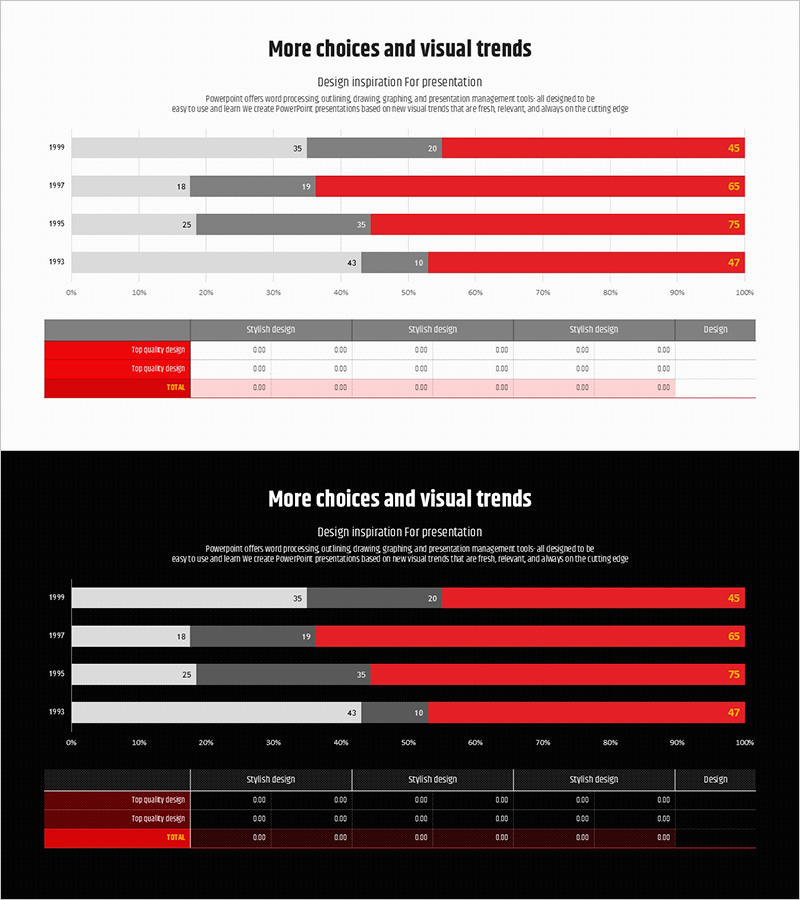
A horizontal bar chart PowerPoint slide optimized for market analysis and trend visualization. The five-item comparison structure in red color series is ready to use for competitive analysis, market overview, and performance benchmarking presentations. This 2-slide deck enables clear data visualization and numerical comparison, formatted in 16:9 widescreen ratio for modern display compatibility. Each bar is fully editable to accommodate your specific metrics and values.
Usage Points
-
Main Usage
Effectively display quantitative comparisons across five categories, allowing audiences to instantly grasp relative magnitudes and rankings. The red color series draws attention and emphasis, providing visual evidence to support presenter commentary on market positioning, competitor benchmarking, or performance metrics.
-
How to Use
Adjust bar lengths to input your actual data values and modify axis labels and legend text as needed. Insert into business reports, marketing plans, investor presentations, or quarterly reviews where quantitative comparison is essential. The slide structure accommodates both single and multi-series data.
-
Recommended For
Marketing managers, business analysts, sales executives, financial analysts, and strategy planners who need to present data-driven insights. Ideal for quarterly performance reviews, market landscape analysis, competitive positioning discussions, and investment pitch decks.
-
Slide Structure
Two-slide layout with title and 5-item horizontal bar chart on the first slide, and a duplicate comparison chart on the second. Each bar features red color gradation with numerical labels and legend included. All elements are fully editable in standard PowerPoint format.
Related Products
-

Pentagon Diagram & Table Chart – Market Analysis and Competitive Insight
#Market and Competitor Analysis #Diagram #Market Analysis
-

Market Trend Analysis Charts & Tables – The Power of Data Visualization
#Market and Competitor Analysis #Diagram #Graph
-

Chemical Experiment Analysis Graph Chart – Visualizing R&D Achievements
#Technical Approach #Market and Competitor Analysis #Diagram
-

Detailed Analysis in Book Illustration PowerPoint Template
#Market and Competitor Analysis #Diagram #Graph
