Competitor and Market Analysis Blue Navy PowerPoint Template
RJ0300015_11
- Last Update 04/21/2025
- File Size 0.3MB
- # of Slides 2
- File Format PPTX
- Slide Ratio 16:9
- Color
Keywords
- #Content-Based Slides
- #Design-Based Slides
- #Market and Competitor Analysis
- #Diagram
- #Graph
- #Competitor Analysis
- #Market Analysis
- #Table
- #Horizontal Bar
- #Horizontal Table
- #Horizontal Bar Chart
- #16:9
- #horizontal bar chart PowerPoint
- #bar graph slide template
- #market analysis presentation
- #competitor comparison chart
- #data visualization PPT slide
About the Product
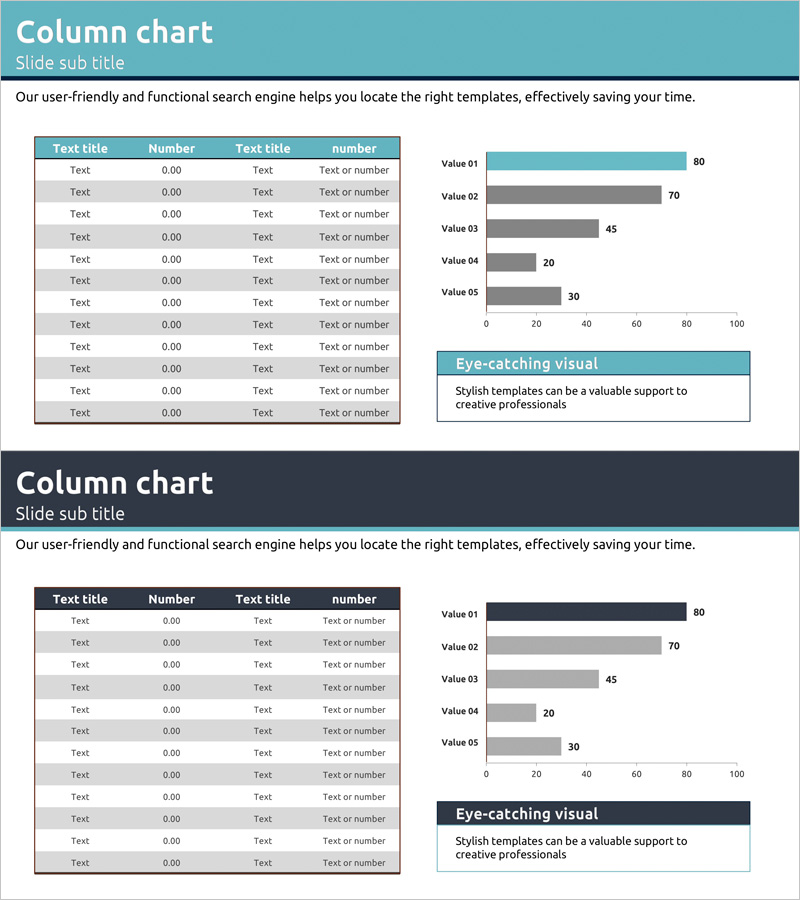
A horizontal bar chart PowerPoint slide designed for competitor and market analysis presentations. Features a teal-colored header with a data table on the left displaying five comparable metrics and a corresponding bar graph on the right visualizing the same data. The dual-layout approach combines detailed numerical information with visual representation for enhanced clarity. Fully editable and ready to use in business reports, strategy presentations, and performance reviews.
Usage Points
-
Main Usage
Ideal for presenting comparative data across five or more categories such as competitor benchmarking, market research findings, sales performance metrics, departmental KPIs, and budget allocations. The combination of table and graph ensures both detailed accuracy and visual impact in executive presentations.
-
How to Use
Replace the sample data in the left table with your actual figures; the right-side bar graph automatically updates. Adjust bar lengths and colors to emphasize key findings. Suitable for board meetings, investor pitches, strategy workshops, and quarterly business reviews where data-driven decision-making is critical.
-
Recommended For
Marketing teams presenting market share analysis, sales departments comparing regional performance, finance teams reporting budget variance, management consultants delivering strategic recommendations, and operations teams benchmarking efficiency metrics. Recommended for any stakeholder presentation requiring quantitative comparison.
-
Slide Structure
Two-slide set. Slide 1: Teal header with title, left-side four-column data table (item name, number, text title, number), right-side horizontal bar graph with five bars (0–100 scale), and bottom highlight box. Slide 2: Identical layout with dark background variant for color contrast options.
Related Products
-

Circular Highlight Bar Graph – Optimal for Market and Competitor Analysis
#Market and Competitor Analysis #Graph #Competitor Analysis
-

Pencil Bar Chart for Market Analysis – Visual Competitiveness
#Market and Competitor Analysis #Graph #Other
-

Competitor and Market Analysis Slide – Pink & Bluegreen PowerPoint Template
#Market and Competitor Analysis #Graph #Competitor Analysis
-

Securities Service Analysis Graph – Competitor Analysis
#Market and Competitor Analysis #Graph #Competitor Analysis
