Healthcare Services Analytics Donut Chart – Insights into Competitive Markets
RM0300017_7
- Last Update 02/11/2025
- File Size 0.3MB
- # of Slides 2
- File Format PPTX
- Slide Ratio 16:9
- Color
Keywords
- #Content-Based Slides
- #Design-Based Slides
- #Market and Competitor Analysis
- #Diagram
- #Graph
- #Competitor Analysis
- #Market Analysis
- #Cluster
- #Circles
- #Closed Cluster Diagram
- #Doughnut Chart
- #16:9
- #donut chart PowerPoint
- #pie chart slide template
- #healthcare market analysis
- #market share visualization
- #competitive analysis presentation
About the Product
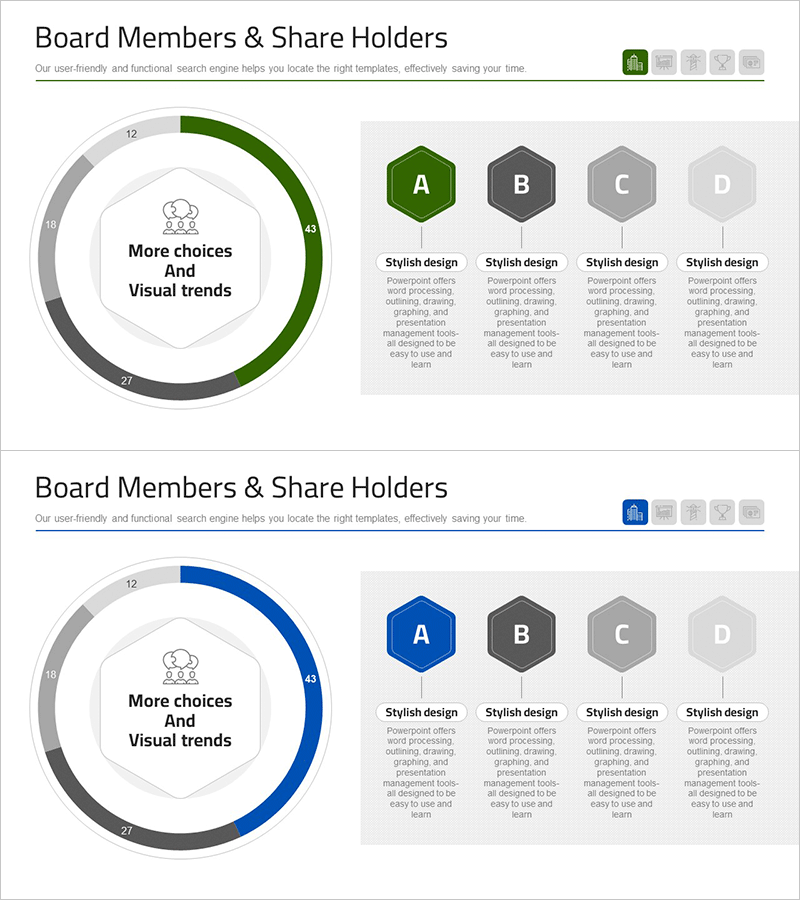
A donut chart PowerPoint slide designed for healthcare services analysis and competitive market insights. This presentation template features a two-tier circular graph in green and gray tones, effectively visualizing market share, competitor comparison, and service composition ratios. The central icon and text area allow you to emphasize key messages, making it ideal for healthcare industry presentations, business reports, and marketing plans. The 16:9 widescreen format with 2-slide composition adapts to various data scenarios and is ready to download and edit immediately.
Usage Points
-
Main Usage
Visualize healthcare industry market share, competitor comparison, and service composition ratios using a donut chart format. The central area highlights key metrics or messages, enabling audiences to grasp complex data at a glance.
-
How to Use
Apply this slide to the market analysis section of business reports, competitive analysis pages in marketing plans, and market size explanation slides in investor pitch decks. Customize segment colors and figures to match your actual data.
-
Recommended For
Healthcare facility executives, healthcare marketing managers, medical consulting firms, pharmaceutical sales teams, and hospital management analysis departments presenting market conditions and competitive positioning.
-
Slide Structure
Two-slide composition: the first slide features a two-tier donut chart (outer ring + inner ring) for multi-layer data representation, while the second slide presents a single donut chart for simple ratio visualization. Green accent color and gray background convey healthcare industry credibility.
Related Products
-

Contribution-Based Performance Chart – Infographic for Market Analysis
#Market and Competitor Analysis #Graph #Competitor Analysis
-

Experimental Results Analysis Vertical Bar Graph – Incorporating Visual Trends
#Market and Competitor Analysis #Diagram #Graph
-

Smart Analytics Insight – Market and Competitive Analysis Presentation
#Market and Competitor Analysis #Graph #Text Box
-

Space Industry Segmentation Bar Graph – Essential for Market Analysis
#Market and Competitor Analysis #Diagram #Graph
