Competitor Revenue Analysis Chart – Visualize Market Dynamics
RM0100014_12
- Last Update 01/29/2025
- File Size 0.3MB
- # of Slides 2
- File Format PPTX
- Slide Ratio 16:9
- Color
Keywords
- #Content-Based Slides
- #Design-Based Slides
- #Market and Competitor Analysis
- #Diagram
- #Graph
- #Competitor Analysis
- #Market Analysis
- #Table
- #Circles
- #Doughnut Chart
- #16:9
- #donut chart PowerPoint
- #pie chart slide template
- #competitor analysis diagram
- #revenue share visualization
- #market share graph
- #business analysis presentation
About the Product
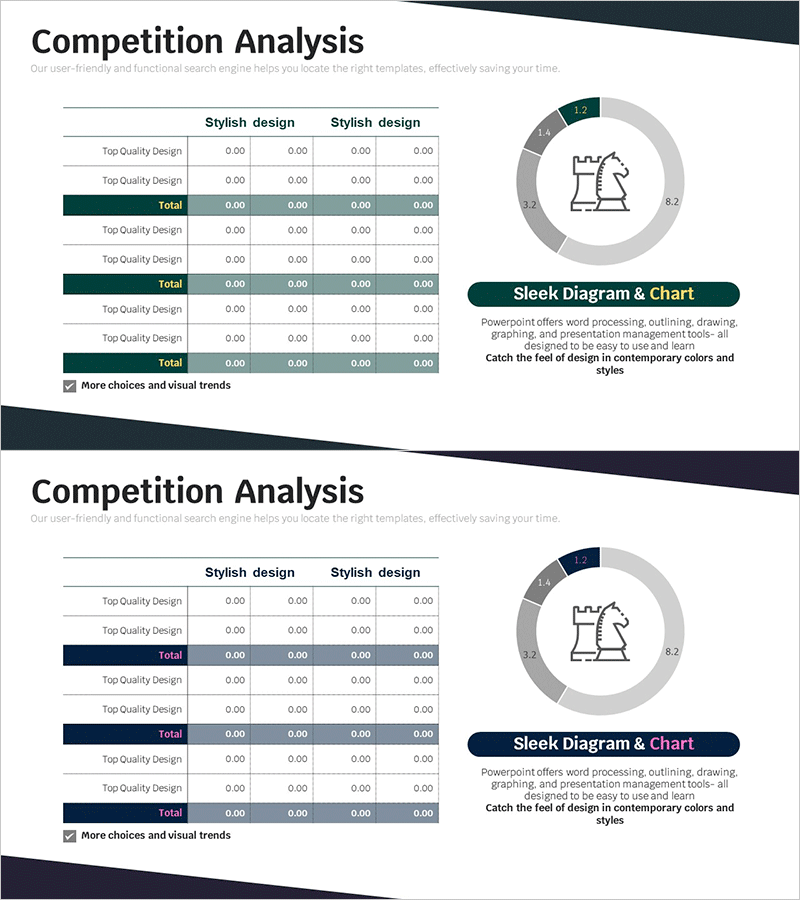
A PowerPoint slide that visualizes competitor revenue composition using a donut chart with four segments. The design features a chess piece icon at the center, surrounded by a segmented circular graph in dark green, gray, and navy tones that convey market share and competitive positioning. Accompanying data tables provide detailed numerical values to support the visual representation. This 16:9 widescreen 2-slide set is ready to integrate into competitive analysis sections of business presentations, offering both visual clarity and quantitative rigor for stakeholder communication.
Usage Points
-
Main Usage
Analyze and compare competitor revenue composition and market share using a donut chart visualization. The layered design—central icon and outer segmented graph—simplifies complex competitive relationships while supporting data tables provide quantitative evidence for strategic decisions.
-
How to Use
Deploy in business strategy presentations, investor pitch decks, and market analysis reports within the competitive analysis section. Edit segment values to reflect actual competitor data and adjust colors to align with corporate branding. The donut structure's visual prominence captures audience attention during live presentations.
-
Recommended For
Ideal for executive teams, strategy departments, marketing teams, and investor presentations. Particularly effective for competitive benchmarking, market positioning, and business opportunity analysis. Commonly used in consulting reports, business plans, and investor relations materials.
-
Slide Structure
Two-slide set: Slide 1 features a chess piece icon at center with four-segment donut chart, accompanied by 'Competitive Analysis' title and descriptive text on the right. Slide 2 contains three data tables (each 2 rows × 4 columns) presenting detailed metrics that support the graphical analysis.
Related Products
-

Visualizing Competitive Analysis with Table and 3 Donut Graphs
#Market and Competitor Analysis #Diagram #Graph
-

Market Segmentation Analysis Table & Donut Chart for Market Insights
#Market and Competitor Analysis #Diagram #Graph
-

Market Analysis Slide Using Donut Charts and Table
#Market and Competitor Analysis #Diagram #Graph
-

Survey and Poll Analysis Graphs – Optimized for Market Analysis
#Market and Competitor Analysis #Diagram #Graph
