Status Analysis Thin Donut Chart - Visualizing Shareholder Status in PowerPoint
RM0300012_7
- Last Update 02/10/2025
- File Size 1.3MB
- # of Slides 2
- File Format PPTX
- Slide Ratio 16:9
- Color
Keywords
- #Content-Based Slides
- #Design-Based Slides
- #Company Introduction
- #Market and Competitor Analysis
- #Diagram
- #Graph
- #Shareholder Structure
- #Market Analysis
- #Cluster
- #Circles
- #Closed Cluster Diagram
- #Doughnut Chart
- #16:9
- #donut chart PowerPoint
- #pie chart slide template
- #shareholder status visualization
- #data ratio presentation
- #donut graph download
About the Product
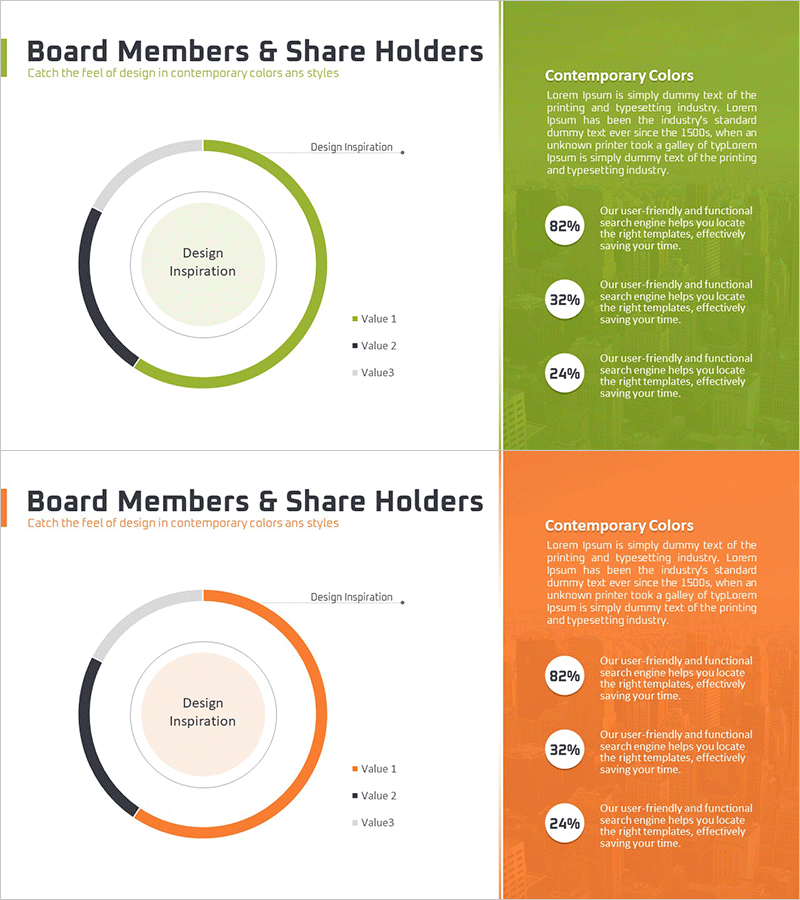
A professional donut chart PowerPoint slide designed to visualize shareholder status and composition with three data segments. This template features two color variations—green and orange—each with a thin donut ring structure that emphasizes data while preserving central space for key messaging. The 16:9 widescreen format includes 2 slides ready for immediate use, with a legend showing Value 1, Value 2, and Value 3 categories. The design accommodates percentage badges (82%, 32%, 24%) and a central 'Design Inspiration' text area, making it ideal for investor presentations, board meetings, market share analysis, and organizational structure reports.
Usage Points
-
Main Usage
Clearly present the proportional relationship between three data categories—such as shareholder composition, market share, or organizational structure—using a donut chart format. The hollow center allows you to insert key metrics, percentages, or core messages to emphasize data importance.
-
How to Use
Deploy in investor presentations, shareholder meetings, executive briefings, and business status reports to explain ownership structure or capital distribution. The green version conveys growth and positivity, while the orange version communicates activity and energy—select based on your presentation context and audience.
-
Recommended For
CFOs, financial officers, investor relations (IR) managers, executives, and consultants explaining shareholder composition or capital structure. Ideal for startup pitch decks, quarterly earnings presentations, M&A negotiation materials, and corporate governance reports.
-
Slide Structure
Each slide features a 3-segment donut chart on the left with a thin ring design and legend (Value 1, Value 2, Value 3), paired with a right-side panel titled 'Contemporary Colors' containing three circular percentage badges (82%, 32%, 24%) and descriptive text. The thin donut ring maximizes the central space for messaging.
Related Products
-

Global Business Growth Analysis Status Graph
#Company Introduction #Market and Competitor Analysis #Diagram
-

Healthcare Services Analytics Donut Chart – Insights into Competitive Markets
#Market and Competitor Analysis #Diagram #Graph
-

Major Shareholder Analysis Chart – Effective Market and Competitive Analysis
#Company Introduction #Market and Competitor Analysis #Diagram
-

Visualizing Genetic Research Data with a Donut Chart
#Product/Service Introduction #Market and Competitor Analysis #Diagram
