Bio Industry Status Analysis Chart
RM0300017_17
- Last Update 02/11/2025
- File Size 0.3MB
- # of Slides 2
- File Format PPTX
- Slide Ratio 16:9
- Color
Keywords
- #Content-Based Slides
- #Design-Based Slides
- #Company Introduction
- #Market and Competitor Analysis
- #Diagram
- #Graph
- #Key Achievements
- #Market Analysis
- #Cluster
- #Column
- #Closed Cluster Diagram
- #Grouped Column
- #16:9
- #grouped bar chart PowerPoint
- #biotech industry analysis slides
- #horizontal vertical bar chart template
- #industry status analysis PPT
- #performance comparison graph download
About the Product
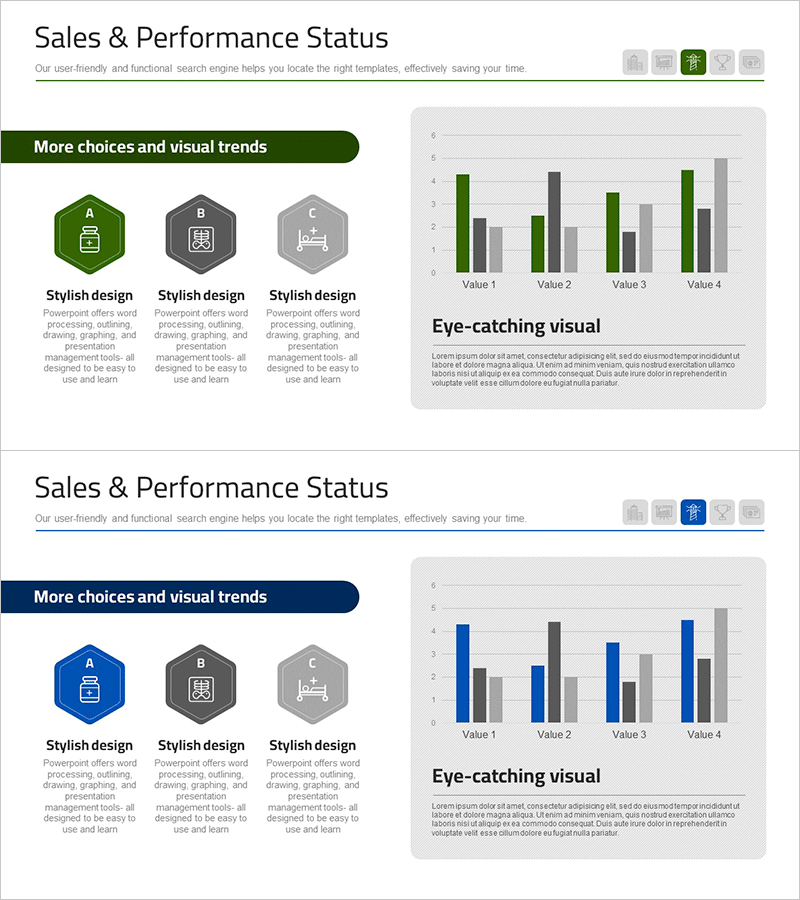
A 2-slide PowerPoint presentation designed for biotech industry status analysis. This deck combines horizontal and vertical bar charts to visualize the same dataset from multiple perspectives. The green and gray color scheme clearly distinguishes primary metrics from comparative data, allowing viewers to assess performance across four values (Value 1–4) at a glance. Ideal for market analysis presentations, performance reports, and industry overview discussions that require immediate deployment.
Usage Points
-
Main Usage
Compares critical biotech industry indicators—market size, growth rate, investment volume, and company count—across four data points. The horizontal bar chart emphasizes rank-based comparison, while the vertical bar chart highlights time-series trends, enabling dual-perspective analysis of identical data.
-
How to Use
Deploy in industry briefings, market analysis reports, investor presentations, and executive summaries when explaining biotech sector performance metrics. The green bar series represents primary indicators while gray represents comparative benchmarks, directing audience focus through color-coded visual hierarchy.
-
Recommended For
Biotech company IR professionals, industry analysts, marketing strategists, management consultants, and policy makers presenting industry data with quantitative rigor. Suitable for academic presentations, business pitches, quarterly reports, and stakeholder communications.
-
Slide Structure
Two-slide layout: Slide 1 features a horizontal bar chart comparing 4 items; Slide 2 displays a vertical bar chart tracking 4 values over time. Both charts employ a dual-color system (green and gray) to differentiate primary metrics from reference data.
Related Products
-

Year-by-Year Comparison Analysis Bundle Graph – Visualizing Market Performance
#Company Introduction #Market and Competitor Analysis #Diagram
-

Current Trends and Issues Analysis Chart – Market and Competitor Analysis
#Market and Competitor Analysis #Diagram #Graph
-

User Analysis Graph by Age Group – Advanced Data Insights
#Market and Competitor Analysis #Diagram #Graph
-

Competitor Comparison Analysis Bar Graph – Data Visualization for Market Analysis
#Market and Competitor Analysis #Diagram #Graph
