Data-driven Market Analysis Strategy – Sleek Graph Slide
RM0300016_17
- Last Update 02/11/2025
- File Size 1.4MB
- # of Slides 2
- File Format PPTX
- Slide Ratio 16:9
- Color
Keywords
- #Content-Based Slides
- #Design-Based Slides
- #Company Introduction
- #Market and Competitor Analysis
- #Graph
- #Key Achievements
- #Market Analysis
- #Column
- #Circles
- #Grouped Column
- #Doughnut Chart
- #16:9
- #donut chart PowerPoint slide
- #pie chart presentation template
- #data visualization slides
- #ratio chart download
- #sales performance graph template
About the Product
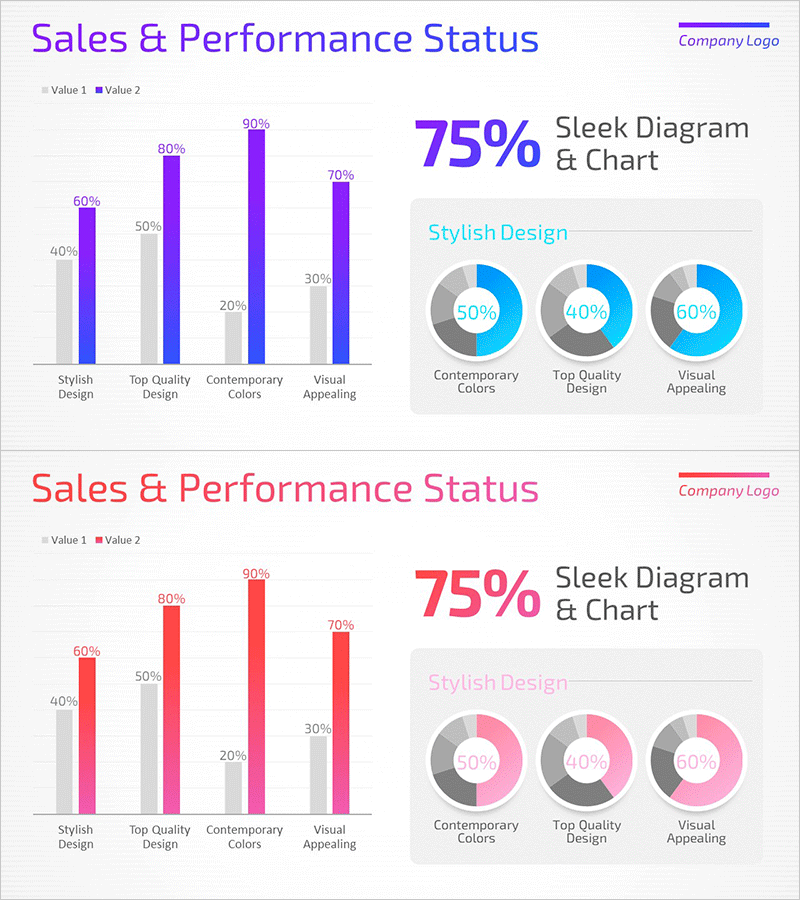
A professional PowerPoint slide template combining bar graphs and donut charts to visualize sales performance and market analysis data. This presentation slide features dual-color options in purple and pink, displaying four-item comparisons with bar charts and three-segment ratio breakdowns with donut charts. Each slide integrates quantitative metrics and percentage distributions for comprehensive data storytelling. Ideal for business reports, quarterly performance presentations, market analysis decks, and executive dashboards requiring multi-dimensional data visualization.
Usage Points
-
Main Usage
Simultaneously visualize quantitative metrics and percentage distributions to communicate complex data analysis clearly. Bar graphs display item-by-item numerical comparisons while donut charts illustrate overall composition ratios intuitively.
-
How to Use
Position in the core data section of sales and performance reports to effectively convey results to executives and stakeholders. Apply to market analysis pages in marketing plans or achievement rate sections in business proposals for comprehensive data storytelling.
-
Recommended For
Sales managers, marketing professionals, financial analysts, and business development executives presenting monthly, quarterly, or annual performance metrics. Suitable for consulting firms, financial institutions, and manufacturing companies conducting internal reporting and client presentations.
-
Slide Structure
Two-slide set with side-by-side layout: left bar graph (4 items with dual Value 1 and Value 2 series) paired with right donut chart (3 segments showing 50%, 40%, 60% ratio distribution). Dual-color scheme in purple and pink, 16:9 widescreen PPTX format with fully editable elements.
Related Products
-

Achievement Performance and Goal Analysis Chart – Visualizing Performance
#Company Introduction #Market and Competitor Analysis #Graph
-

Sales & Performance Status Slide – Data-Driven Insights
#Company Introduction #Market and Competitor Analysis #Diagram
-

Smart Analytics Insight – Market and Competitive Analysis Presentation
#Market and Competitor Analysis #Graph #Text Box
-

Curved Theme Purple Template Donut Chart – A Stylish Choice for Market Analysis
#Company Introduction #Market and Competitor Analysis #Graph
