Achievement Performance and Goal Analysis Chart – Visualizing Performance
RM0300019_17
- Last Update 02/12/2025
- File Size 0.4MB
- # of Slides 2
- File Format PPTX
- Slide Ratio 16:9
- Color
Keywords
- #Content-Based Slides
- #Design-Based Slides
- #Company Introduction
- #Market and Competitor Analysis
- #Graph
- #Key Achievements
- #Market Analysis
- #Column
- #Circles
- #Grouped Column
- #Doughnut Chart
- #16:9
- #donut chart PowerPoint slide
- #pie chart presentation template
- #performance analysis chart
- #ratio visualization PPT
- #circular graph slide design
About the Product
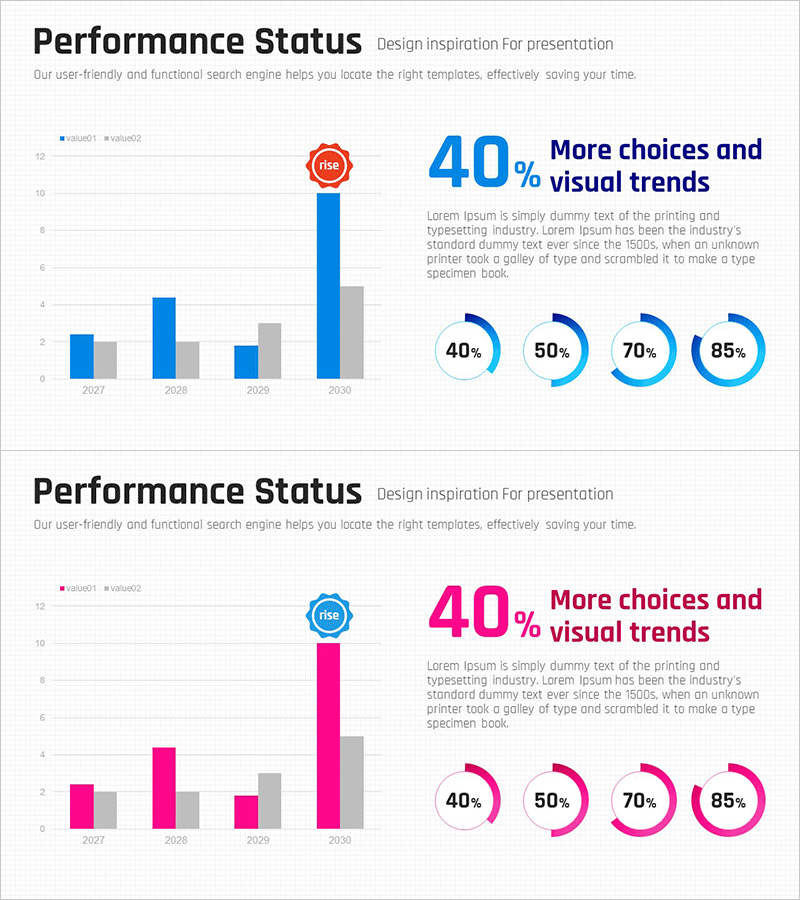
A donut chart PowerPoint slide designed to visualize achievement performance and goal analysis with four comparable segments. This 2-slide set features a blue and orange dual-tone color scheme, with percentage values and labels clearly displayed for each section. Ideal for executive reports, business performance analysis, market share comparisons, and quarterly results presentations. The 16:9 widescreen PPTX format is compatible with all PowerPoint versions, allowing you to edit colors, values, and labels to match your specific data. The donut structure enables you to place key metrics or titles in the center for enhanced emphasis.
Usage Points
-
Main Usage
Visually represent the proportional relationships of four key metrics such as achievement rates, goal completion percentages, market share distribution, and competitive comparisons. The donut structure allows central placement of critical figures or titles for maximum impact.
-
How to Use
Apply to executive performance reports, quarterly results presentations, marketing strategy meetings for market share analysis, investor pitch decks for business performance visualization, and strategic planning sessions. Simply modify the segment colors and percentage values to match your actual data.
-
Recommended For
CFOs and finance professionals presenting quarterly results, marketing teams analyzing market performance, executives in strategy meetings, investors during pitch presentations, and business analysts preparing performance reports.
-
Slide Structure
Slide 1: Blue donut chart with 4 segments (40%, 50%, 70%, 85% values) plus orange accent badge. Slide 2: Pink-toned donut chart with identical 4-segment structure and circular progress indicators. Both slides include legend areas and descriptive text zones for customization.
Related Products
-

Data-driven Market Analysis Strategy – Sleek Graph Slide
#Company Introduction #Market and Competitor Analysis #Graph
-

Year-over-year Performance Comparison Chart – Key to Business Analysis
#Company Introduction #Market and Competitor Analysis #Diagram
-

Bio Industry Status Analysis Chart
#Company Introduction #Market and Competitor Analysis #Diagram
-

Future Technology Business Analysis Chart – Performance Focus
#Company Introduction #Market and Competitor Analysis #Graph
