Major Shareholder Analysis Chart – Effective Market and Competitive Analysis
RM0600003_6
- Last Update 02/23/2025
- File Size 0.9MB
- # of Slides 2
- File Format PPTX
- Slide Ratio 16:9
- Color
Keywords
- #Content-Based Slides
- #Design-Based Slides
- #Company Introduction
- #Market and Competitor Analysis
- #Diagram
- #Graph
- #Shareholder Structure
- #Market Status
- #Cluster
- #Circles
- #Closed Cluster Diagram
- #Doughnut Chart
- #16:9
- #donut chart PowerPoint
- #pie chart slide template
- #shareholder composition ratio
- #data visualization presentation
- #donut graph PowerPoint download
About the Product
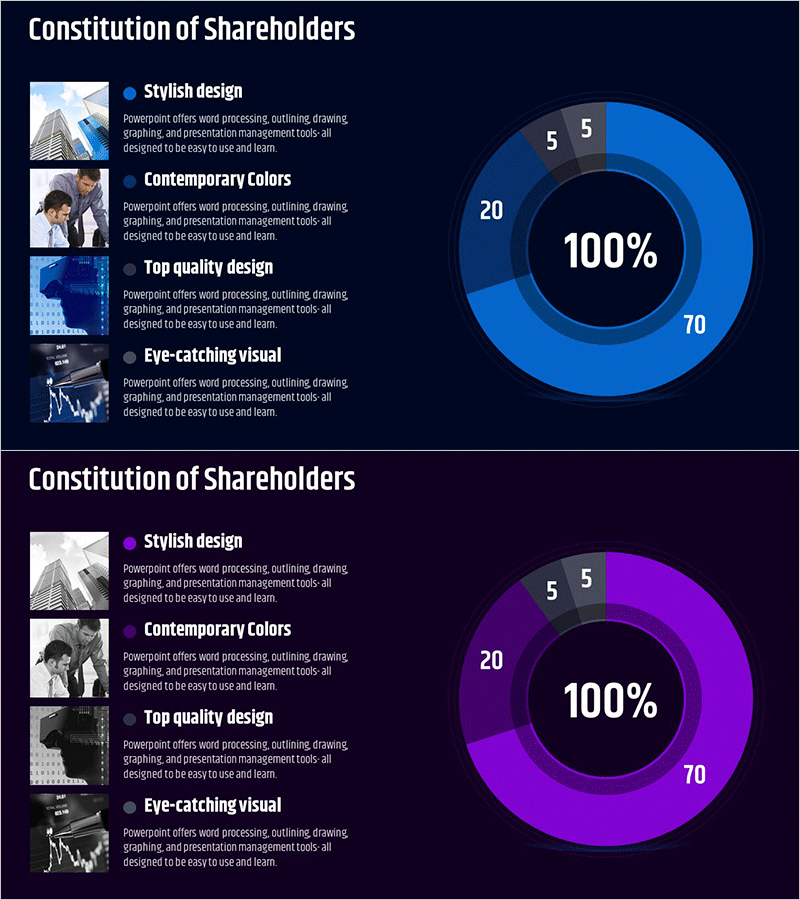
A donut chart PowerPoint slide designed to visualize major shareholder analysis and market share distribution. The slide features a central 100% figure with four segments (70, 20, 5, 5) displayed in the outer ring using blue and gray gradient colors on a dark background. The 2-slide set includes an identical layout version in purple tones, making it ready for immediate use in executive presentations, reports, and investor communications. The left side includes a description area for each segment, allowing you to provide context alongside the data visualization.
Usage Points
-
Main Usage
This donut chart is optimized for presenting the proportional relationship between parts and the whole, such as major shareholder composition, market share, or customer distribution. The central figure emphasizes the key metric, while the color-coded outer ring clearly distinguishes each segment.
-
How to Use
Use this slide in executive reports, investor presentations, quarterly earnings announcements, and market analysis materials when explaining composition ratios. Simply enter descriptions for each segment (company names, shareholding percentages, market share figures) in the left text area and edit the chart values as needed.
-
Recommended For
Finance teams, executives, marketing departments, and strategic planning teams creating shareholder composition, revenue breakdown, customer distribution, and market share analysis materials. Particularly effective for investor relations presentations, business plans, and quarterly report sections to enhance data credibility.
-
Slide Structure
The 2-slide set provides identical layouts in blue and purple versions. Each slide consists of a left description area with four items (icons and text) and a right donut chart. The central 100% figure and four outer segments (70, 20, 5, 5) are clearly displayed with distinct color differentiation.
Related Products
-

Global Business Growth Analysis Status Graph
#Company Introduction #Market and Competitor Analysis #Diagram
-

Market Status Donut Pie Chart – Intuitive Data Visualization
#Market and Competitor Analysis #Diagram #Graph
-

Chart of Changes in the Ratio of Institutional and Individual Investors – Simplified Shareholder Composition
#Company Introduction #Market and Competitor Analysis #Graph
-

Visualizing Market Overview with Doughnut Chart Slide - Global Insights Provided
#Market and Competitor Analysis #Diagram #Graph
