Performance Analysis Breakdown Bar Graph – Market and Competitor Analysis
RM0300009_7
- Last Update 02/09/2025
- File Size 0.3MB
- # of Slides 2
- File Format PPTX
- Slide Ratio 16:9
- Color
Keywords
- #Content-Based Slides
- #Design-Based Slides
- #Company Introduction
- #Market and Competitor Analysis
- #Diagram
- #Graph
- #Shareholder Structure
- #Market Analysis
- #Cluster
- #Horizontal Bar
- #Closed Cluster Diagram
- #Segmented Horizontal Bar
- #16:9
- #breakdown bar graph PowerPoint
- #performance analysis slide template
- #4-series bar chart
- #market analysis PowerPoint
- #competitor comparison chart
- #how to create breakdown bar graph in PowerPoint
About the Product
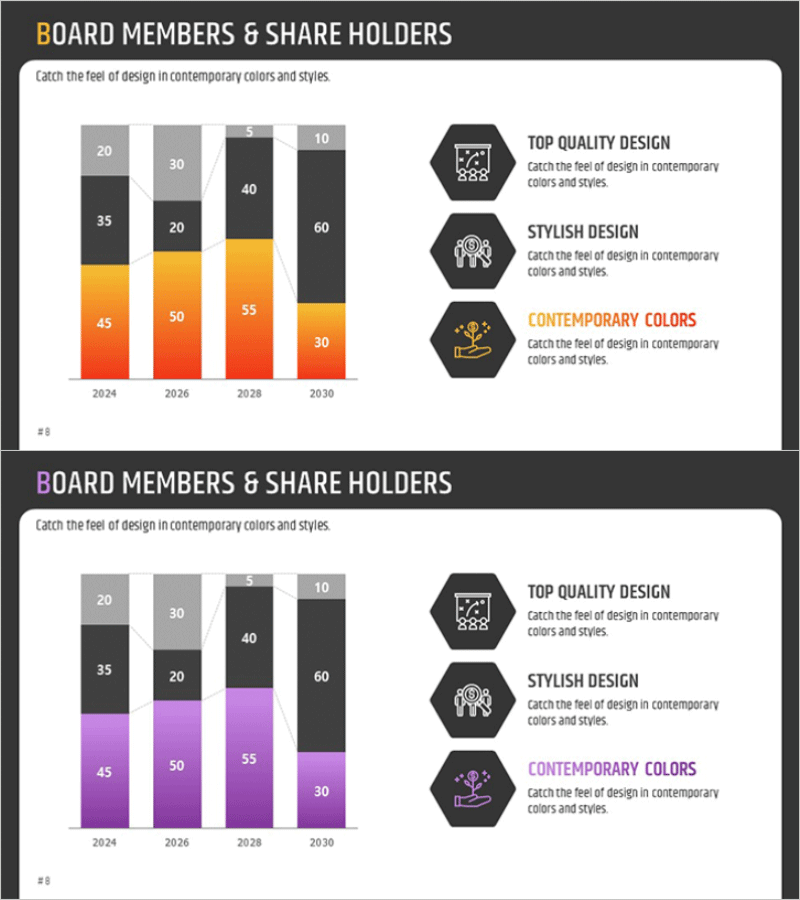
A breakdown bar graph PowerPoint slide designed for performance analysis and market competitor comparison. This presentation template visualizes four data series across years (2024–2030) using orange and gray gradient tones, with clear numerical labels displayed above each bar segment. The 2-slide set includes a stacked bar format on the first slide and a segmented ratio structure on the second, offering multiple analytical perspectives. Ideal for shareholder analysis, market share reporting, and departmental performance reviews, this slide deck is ready to use and fully editable for your specific data.
Usage Points
-
Main Usage
Effectively displays multi-series data trends across time periods while enabling item-by-item comparison simultaneously. The dual visualization approach—stacked and segmented formats—makes it ideal for presenting market share, departmental performance, shareholder composition, and other complex analytical data to executives.
-
How to Use
Use in executive reports, quarterly performance presentations, investor briefings, and board meetings. Customize the numerical values and color scheme to match your organization's data. The slide is optimized for 16:9 widescreen format and fully editable in PowerPoint.
-
Recommended For
CFOs, financial analysts, marketing strategy teams, business planning departments, and sales managers presenting quarterly performance reviews, market competitive analysis, and shareholder status reports. Particularly recommended for executive-level reporting requiring multi-data comparison.
-
Slide Structure
2-slide set featuring a 4-series stacked bar graph (2024–2030 annual data) on the first slide and the same data presented as segmented ratios on the second. Each bar includes numerical labels, with gray and orange gradient colors distinguishing the data series.
Related Products
-

Space Industry Segmentation Bar Graph – Essential for Market Analysis
#Market and Competitor Analysis #Diagram #Graph
-

Market Analysis Graph Ahead of the Future – Innovative Business Insights
#Market and Competitor Analysis #Diagram #Graph
-

Business Solutions Analysis Graph – The Optimal Tool for Market Analysis
#Business Introduction #Market and Competitor Analysis #Diagram
-

Crop Analysis Detailed Bar Graph – Insights into Market and Competition
#Market and Competitor Analysis #Diagram #Graph
