Shareholder Status Analysis Data Chart – Insights and Market Analysis
RM0300020_7
- Last Update 02/12/2025
- File Size 0.3MB
- # of Slides 2
- File Format PPTX
- Slide Ratio 16:9
- Color
Keywords
- #Content-Based Slides
- #Design-Based Slides
- #Company Introduction
- #Market and Competitor Analysis
- #Diagram
- #Graph
- #Shareholder Structure
- #Market Analysis
- #Table
- #Horizontal Bar
- #Standard Table
- #Segmented Horizontal Bar
- #16:9
- #horizontal bar chart PowerPoint
- #data chart template
- #shareholder analysis slide
- #how to create bar graph in PowerPoint
- #business report chart
- #comparative data visualization
About the Product
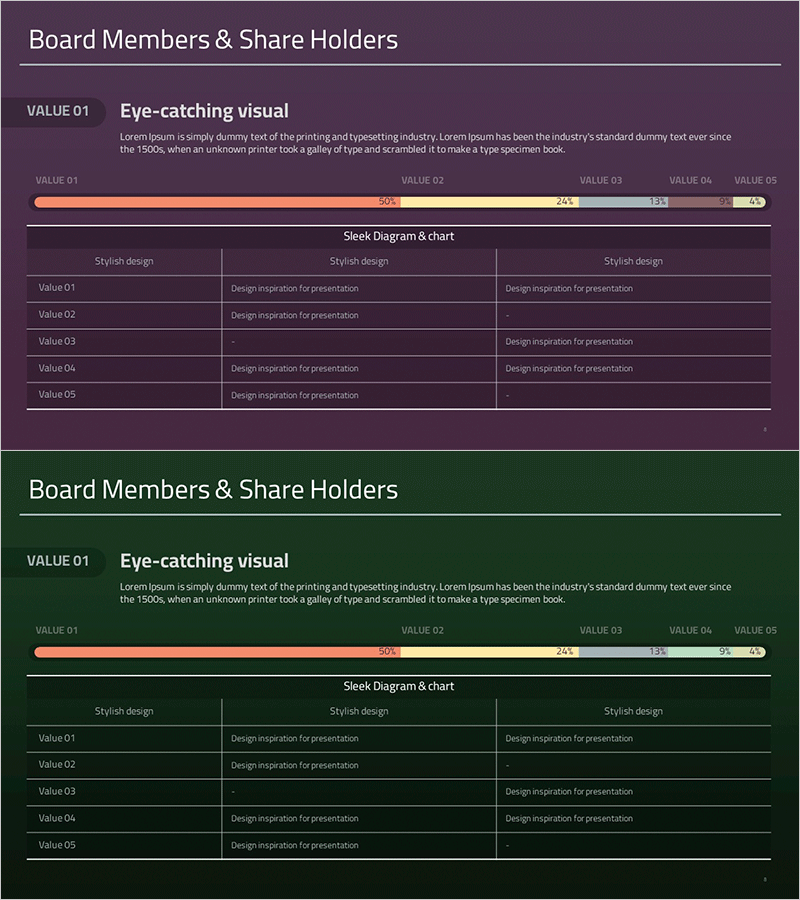
A horizontal bar chart PowerPoint slide designed for shareholder status analysis and market insights. The slide features an orange gradient bar design with data labels that clearly display five comparative data points. This 2-slide set in 16:9 widescreen format is ready to use in investor presentations, board reports, and market analysis decks. Each bar includes percentage values and is complemented by a detailed data table on the second slide, making it suitable for both digital presentations and printed materials.
Usage Points
-
Main Usage
Visualize and compare five key data points such as shareholder composition, market share, or sales performance using a horizontal bar chart format. The design enables quick visual comparison of relative values while percentage labels ensure precise numerical communication.
-
How to Use
Use in investor relations meetings, shareholder assemblies, executive briefings, quarterly earnings presentations, and strategic planning sessions. Simply replace the data values and category labels with your own information to create a customized analysis slide.
-
Recommended For
CFOs, financial analysts, investor relations professionals, executives, market researchers, and business intelligence teams presenting quarterly reports, earnings calls, strategic reviews, and data-driven decision-making sessions.
-
Slide Structure
2-slide set: Slide 1 features a horizontal bar chart with 5 items in orange gradient with percentage labels; Slide 2 presents the same data in detailed table format. Both slides are optimized for 16:9 widescreen presentations and support modern business communication standards.
Related Products
-

Status Analysis Donut Chart – Visualizing Market and Shareholder Status
#Company Introduction #Market and Competitor Analysis #Diagram
-

Status Analysis Donut Link Chart – Market and Competitor Analysis
#Company Introduction #Market and Competitor Analysis #Diagram
-

Visualizing Board Members and Shareholders with a Sleek Diagram
#Company Introduction #Market and Competitor Analysis #Diagram
-

Red Ratio Horizontal Bar Graph – Market Analysis and Trends
#Market and Competitor Analysis #Diagram #Graph
